I am a self-taught Mathematica user, trying to make some progress. This is my code:
Manipulate[
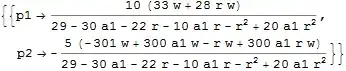
Solve[
{(p1 a1 + p2 .2) (1 + r) + w 1 == p1, (p1 .1 + p2 .4) (1 + r) + w 30 == p2},
{p1, p2}],
{r, 0, .45},
{a1, 0, .6}]
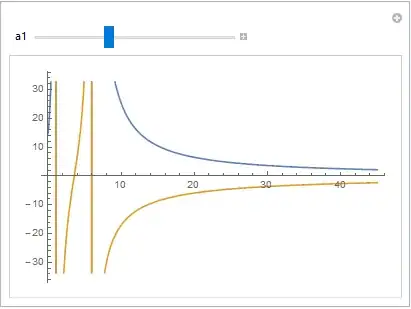
I can get the manipulate-sliders for r and a1. However, I haven´t been able to integrate the plot and the manipulate functions/commands in order to get a two-dimensional plot for p1 and p2 (y-axis) as a function of r (x-axis) while manipulating the values of a1.