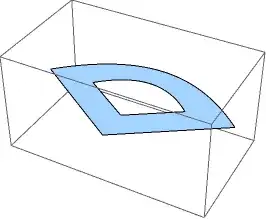
21

FilledCurve can create a 2D graphics object; for example:

a = {{-1, 0}, {0, 1}, {1, 0}}; b = {{0, -(2/3)}};
Graphics[FilledCurve[{{BezierCurve[2 a], Line[2 b]}, {BezierCurve[a], Line[b]}}]] 

a FilledCurve in 2D

How can I put a Graphics3D object like this on a plane, say $z=0$, and create something like the following 3D graphic (without mapping it on a polygon as a texture)?

a 3D version?

J. M.'s missing motivation
  • 124,525
  • 11
  • 401
  • 574
xslittlegrass
  • 27,549
  • 9
  • 97
  • 186

3 Answers3

22

Here is some code to convert filled curves to polygons (2D or 3D).

Updated

(I had the same idea as J.M., to combine the best of both answers...)

  • The code now handles filled curves containing BSplineCurve primitives as well as BezierCurve and Line.
  • The curve primitives are converted to lines using J.M.'s ParametricPlot trick, ensuring good sampling.
  • Disconnected polygons such as separate letters are kept as separate polygons. Polygons representing holes are merged with their parent polygon.

The conversion is done using the functions filledCurveToPolygons and filledCurveToPolygons3D. The rest of the code is helper functions.

The basic process is to convert the FilledCurve to a nested list of line and curve primitives, convert the curves to lines, and then convert the lines to polygons. The devil is in the detail of course, in particular handling the coordinate lists to make sure each segment starts and finishes at the same point - this is crucial to get the holes to work properly.

Examples

a = {{-1, 0}, {0, 1}, {1, 0}}; b = {{0, -(2/3)}};
fc = FilledCurve[{{BezierCurve[2 a], Line[2 b]}, {BezierCurve[a], Line[b]}}];
Graphics3D[filledCurveToPolygons3D[fc]]

enter image description here

fc = ImportString[ExportString[
 Style["ABC", FontFamily -> "Times"], "PDF"]][[1, 1, 2, 1, 1]];
Graphics3D[filledCurveToPolygons3D[fc]]

enter image description here

Note that polygons have edges joining the holes with the outsides - these seem to be hidden in Graphics3D but are visible in the 2D version:

Graphics[{EdgeForm[Red], Yellow, filledCurveToPolygons[fc]}]

enter image description here

To show outlines in 2D it is better to display the polygons without edges, and add the outlines separately using filledCurveToLines:

Graphics[{Yellow, filledCurveToPolygons[fc], Red, filledCurveToLines[fc]}]

enter image description here

Here's the code:

toSegments[fc : FilledCurve[_List, _List]] :=
 First@GeometricFunctions`DecodeFilledCurve[fc]
toSegments[FilledCurve[data : {_List ..}]] := data
toSegments[FilledCurve[data : _List]] := {data}
toSegments[FilledCurve[data_]] := {{data}}

processSegment[seg_List] := Module[{s, pts, st, fi},
  s = seg; pts = s[[All, 1]];
  If[Length[pts] > 1, s[[2 ;;, 1]] = Join[pts[[;; -2, {-1}]], pts[[2 ;;]], 2]];
  st = pts[[1, 1]]; fi = pts[[-1, -1]];
  If[st != fi, AppendTo[s, Line[{fi, st}]]];
  s]

segmentsToLines[segs_] := segs /. {
   BezierCurve[data_, opts___] :> First@Cases[
      ParametricPlot[BezierFunction[data, opts][t], {t, 0, 1}], _Line, -1],
   BSplineCurve[data_, opts___] :> First@Cases[
      ParametricPlot[BSplineFunction[data, opts][t], {t, 0, 1}], _Line, -1]}

coordList[seg_] := Module[{temp},
  temp = seg /. Line -> Sequence;
  temp[[2 ;;]] = temp[[2 ;;, 2 ;;]];
  Join @@ temp]

processHoles[polys_] := With[{ipq = Graphics`Mesh`InPolygonQ}, 
  polys //. {a___, p : Polygon[x_], q : Polygon[y_], b___} /; 
     ipq[p, y[[2]]] || ipq[q, x[[2]]] :> {a, Polygon[Join[x, y, {First@x}]], b}]

filledCurveToLines[fc_FilledCurve] := 
 segmentsToLines[processSegment /@ toSegments[fc]]

filledCurveToPolygons[fc_FilledCurve] := 
 processHoles[Polygon /@ coordList /@ filledCurveToLines[fc]]

filledCurveToPolygons3D[fc_FilledCurve] :=
 filledCurveToPolygons[fc] /. 
  Polygon[data_] :> Polygon[ArrayPad[data, {{0, 0}, {0, 1}}]]
Simon Woods
  • 84,945
  • 8
  • 175
  • 324
  • 4
    I keep forgetting [GeometricFunctions`DecodeFilledCurve[]](http://mathematica.stackexchange.com/a/570)... rather useful. – J. M.'s missing motivation May 10 '13 at 11:06
  • Thanks, that's wonderful! But there seems to be a problem on my computer when I try the example of "ABC". The hole in the letter "A" doesn't show up. And it seems to because the processHoles function can only handel the case that polygon x is larger than polygon y, but on my computer y is larger than x somehow. I'm using V9 on mac. – xslittlegrass May 10 '13 at 15:45
  • @xslittlegrass, try changing the RHS of processHoles to this: polys//.{a___,p:Polygon[x_],q:Polygon[y_],b___}/;Graphics`Mesh`InPolygonQ[p,y[[2]]]||Graphics`Mesh`InPolygonQ[q, x[[2]]]:>{a,Polygon[Join[x,y,{First@x}]],b} – Simon Woods May 10 '13 at 15:55
  • @xslittlegrass, thanks for letting me know (and for the accept). I've updated the code in the answer. – Simon Woods May 11 '13 at 12:25
  • On Mathematica 10, the problem of the hole in the letter "A" that doesn't show up reappears. The solution is here – andre314 Jul 06 '16 at 20:00
  • A sweet piece of code -- however, I've noticed that it does not knock the holes out of the percent character (%). The triple-donut case, "‰", fares even worse, and comes out as a rectangle frame, with nothing circular in sight. – M. Robinson Jul 08 '18 at 20:46
5

Cheating a bit:

a = {{-1, 0}, {0, 1}, {1, 0}}; b = {{0, -2/3}};

big = First @ Cases[ParametricPlot[BezierFunction[2 a][t], {t, 0, 1}], Line[l_] :> l, ∞];
small = First @ Cases[ParametricPlot[BezierFunction[a][t], {t, 0, 1}], Line[l_] :> l, ∞];

Graphics3D[{Directive[Black, EdgeForm[]], Polygon[Map[Append[#, 0] &,
                  (2 b) ~Join~ big ~Join~ (2 b) ~Join~ b ~Join~ Reverse[small] ~Join~ b]]},
           Lighting -> "Neutral"]

fake filled curve


I decided to extend Simon's fine answer to be able to handle both Béziers and B-splines, as well as enabling adaptive sampling. Here is the result:

toSegments[fc_FilledCurve] :=
            First @ If[Length[fc] == 1, Identity, GeometricFunctions`DecodeFilledCurve][fc]

sampleSegment[prims_List, opts___] := 
 If[First[#] != Last[#], Append[#, First[#]], #] &[
    Apply[Join, prims /. {(b : (BSplineCurve | BezierCurve))[data_, rest___] :> 
          Block[{bf, h, t},
                h = Switch[b, BSplineCurve, BSplineFunction, BezierCurve, BezierFunction];
                bf = Apply[h, {data, rest} /.
                           (SplineDegree -> 3) :> (SplineDegree -> Automatic)];
                First @ Cases[ParametricPlot[bf[t], {t, 0, 1}, opts], Line[l_] :> l, ∞]],
             Line -> Sequence}]]

filledCurvetoPolygon[fc_FilledCurve] := With[{s = sampleSegment /@ toSegments[fc]},
       Polygon[ArrayPad[Join @@ (Append[#, s[[1, -1]]] & /@ s), {{0, 0}, {0, 1}}]]]
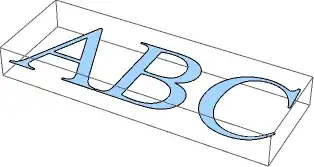
Examples:

Graphics3D[filledCurvetoPolygon[First @ Cases[
           ImportString[ExportString["AB", "PDF"]], _FilledCurve, ∞]]]

some letters

pts = {{0., -0.5}, {0.5, -0.5}, {0.5, 0.5}, {0., 0.5}, {-0.5, 0.5},
       {-0.5, -0.5}, {0., -0.5}};
w = {1, .5, .5, 1, .5, .5, 1};
k = {0, 0, 0, 1/4, 1/2, 1/2, 3/4, 1, 1, 1};

FilledCurve[{{BSplineCurve[2 pts, SplineDegree -> 2, SplineKnots -> k, SplineWeights -> w]},
             {BSplineCurve[pts, SplineDegree -> 2, SplineKnots -> k, SplineWeights -> w]}}]
// filledCurvetoPolygon // Graphics3D

annulus

J. M.'s missing motivation
  • 124,525
  • 11
  • 401
  • 574
  • Thanks for the answer, that's very helpful. But if we have multiple holes, do you have any ideas to automatic find the points to break the loop, instead of manually break them? For example ImportString[ExportString[AB, "PDF"], "PDF"][[1, 1, 2, 1, 1]] gives a FilledCurve object with multiple holes. Thanks. – xslittlegrass May 10 '13 at 06:09
  • That'd be tougher to do. Choosing where to break seems nontrivial. – J. M.'s missing motivation May 10 '13 at 06:11
  • Looks like we both had the same idea :-) – Simon Woods May 10 '13 at 13:55
  • @Simon, thanks to your refresher on that decoding function. :) – J. M.'s missing motivation May 10 '13 at 13:58
  • 1
    @J.M. you probably noticed that the BezierCurves returned by the decoding function seem to be missing a point (which is why the SplineDegree is too high). I think FilledCurve assumes that each line or curve starts from the end of the previous one, so to get "stand alone" curves you need to prepend each one's coordinate list with the last coordinate of the preceding curve. – Simon Woods May 10 '13 at 14:29
  • @Simon, I had to hack out the replacement of SplineDegree -> 3 to Automatic as a temporary workaround, but that suggestion looks better. I'll try out your suggestion... – J. M.'s missing motivation May 10 '13 at 14:31
3

Maybe the right way is to use RegionFunction for this, then it's very straight forward if we have a test function that checks whether a point lies inside given filled curve or not. I use rasterization to perform such test, but i'm sure it can be done better.

a = {{-1, 0}, {0, 1}, {1, 0}}; b = {{0, -2/3}};
g = Graphics[
   FilledCurve[{{BezierCurve[2 a], Line[2 b]}, {BezierCurve[a], 
      Line[b]}}], PlotRange -> {{-2, 2}, {-2, 2}}];
i = Rasterize[g, ImageSize -> {256, 256}];

Plot3D[0, {x, -2, 2}, {y, -2, 2}, 
 RegionFunction -> (PixelValue[i, {64 (#1 + 2), 64 (#2 + 2)}] == {0, 
      0, 0} &)]
swish
  • 7,881
  • 26
  • 48