I'm wondering how to display the support $\mathrm{supp}(f)$ of a piecewise surface $z = f(x,y)$.
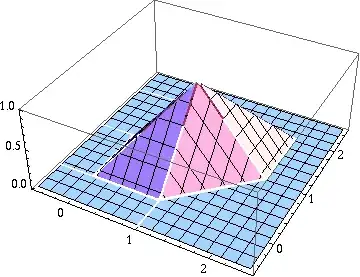
As an example, let's consider the following piecewise function (and plot it):
f[x_, y_] = Piecewise[{{1, 0 <= x <= 1 && 0 <= y <= 1}}];
g[x_, y_] = Integrate[f[x - t, y - t], {t, 0, 1}];
Plot3D[g[x, y], {x, -0.5, 2.5}, {y, -0.5, 2.5}, PlotRange -> Full]
My first thought was to use a contour plot for this purpose, such as
ContourPlot[g[x, y] == .05, {x, -0.5, 2.5}, {y, -0.5, 2.5}]
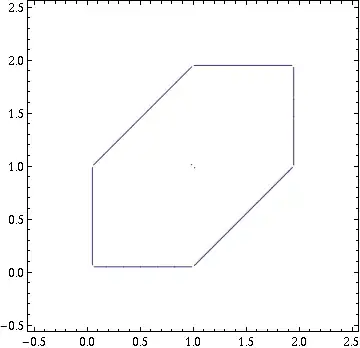
But this is of course only an approximation of the support. How do I display the actual support of my piecewise function?
Edit
The proposed solution in the comments below works great, the result looks as follows:

 .
.


RegionPlot[Or @@ Most[First[Internal`FromPiecewise[g[x, y]]]] // Evaluate, {x, -0.5, 2.5}, {y, -0.5, 2.5}]? – J. M.'s missing motivation Jun 19 '13 at 09:59RegionPlot[ g[x, y] > 0, {x, -0.5, 2.5}, {y, -0.5, 2.5}]– Artes Jun 19 '13 at 10:00