belisarius beat me to the Column replacement rule method.
An alternative method would be to use ShowLegend to construct the legend manually, taking the code for the layout from the FullForm of your original graphic. The ridiculously complex lokking color specifications happen to be the Mathematica defaults for bar charts.
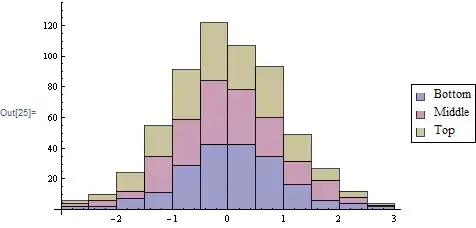
ShowLegend[ Histogram[{bottom, middle, top}, 10,  ChartLayout -> "Stacked"],
 {{{Graphics[{GrayLevel[0.9],
      Directive[GrayLevel[0.85], EdgeForm[Opacity[0.7]], Opacity[0.5],
        RGBColor[0.6, 0.5470136627990908, 0.24]],
      Rectangle[{0, 0}, {1, 1}]}, {ImageSize -> 10}],
    "Top"}, {Graphics[{GrayLevel[0.9],
      Directive[GrayLevel[0.85], EdgeForm[Opacity[0.7]], Opacity[0.5],
        RGBColor[0.6, 0.24, 0.4428931686004542]],
      Rectangle[{0, 0}, {1, 1}]}, {ImageSize -> 10}],
    "Middle"}, {Graphics[{GrayLevel[0.9],
      Directive[GrayLevel[0.85], EdgeForm[Opacity[0.7]], Opacity[0.5],
        RGBColor[0.2472, 0.24, 0.6]],
      Rectangle[{0, 0}, {1, 1}]}, {ImageSize -> 10}], "Bottom"}},
  LegendPosition -> {0.25, 0.2}, LegendBackground -> White,
  LegendBorder -> None, LegendShadow -> None,
  LegendSize -> {0.6, 0.35}, LegendBorder -> None,
  LegendTextSpace -> 3}]