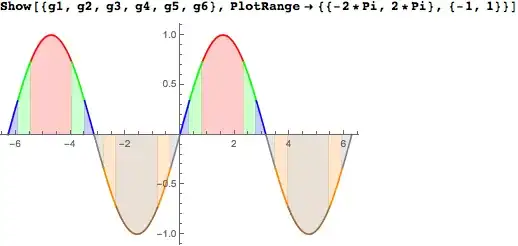
Show combines multiple Graphics objects together, but it only works after everything has already been processed. So, it has to make some judgements on how to combine the resulting options together, and for most it uses the options present in the first Graphics object. Looking at your original graphic, I suspect it is the first plot that causes the issues,
In[17]:= Options[g1, {PlotRange, AxesOrigin}]

Out[17]= {PlotRange -> {{-2 \[Pi], 2 \[Pi]}, {0.536887, 0.999999}},
 AxesOrigin -> {0, 0.52}}
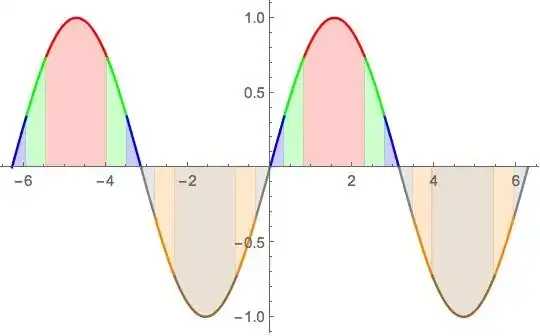
As you can see, Plot is setting the PlotRange fairly high, but the issue is the AxesOrigin which is causing the fill to not go to the same point as the other graphs. To correct that, add AxesOrigin -> {0, 0} to all your plots, but it is not needed in Show. Then you get this,
Now time for overkill. As there are a number of options that are the same across the plots, it often pays to set them for all the plots, but if you use SetOptions you need to remember to restore them afterwards. So, I would use a custom environment:
ClearAll[BlockOptions];
SetAttributes[BlockOptions, HoldAll];
BlockOptions[f : {_Symbol, ___?OptionQ | {___?OptionQ}}, body_] :=
 BlockOptions[{f}, body]
BlockOptions[f : {{_Symbol, ___?OptionQ | {___?OptionQ}} ...},
  body_] :=
 With[{fcns = f[[All, 1]]},
  Internal`InheritedBlock[fcns,
   SetOptions @@@ f;
   body
   ]
  ]
where BlockOptions temporarily changes the options for you. (See this answer for the details of Internal`InheritedBlock). Then, your code becomes
Show@
 BlockOptions[
  {Plot, Filling -> Axis, PlotRange -> {-1, 1}},
  {
   Plot[Sin[x], {x, -2*Pi, 2*Pi},
    RegionFunction -> Function[x, ArcSin[2/3] < Sin[x] < ArcSin[1]],
    PlotStyle -> Red],
   Plot[Sin[x], {x, -2*Pi, 2*Pi},
    RegionFunction -> Function[x, ArcSin[1/3] < Sin[x] < ArcSin[2/3]],
     PlotStyle -> Green],
   Plot[Sin[x], {x, -2*Pi, 2*Pi},
    RegionFunction -> Function[x, ArcSin[0] < Sin[x] < ArcSin[1/3]],
    PlotStyle -> Blue],
   Plot[Sin[x], {x, -2*Pi, 2*Pi},
    RegionFunction -> Function[x, ArcSin[-1/3] < Sin[x] < ArcSin[0]],
    PlotStyle -> Gray],
   Plot[Sin[x], {x, -2*Pi, 2*Pi},
    RegionFunction ->
     Function[x, ArcSin[-2/3] < Sin[x] < ArcSin[-1/3]],
    PlotStyle -> Orange],
   Plot[Sin[x], {x, -2*Pi, 2*Pi},
    RegionFunction -> Function[x, ArcSin[-1] < Sin[x] < ArcSin[-2/3]],
     PlotStyle -> Brown]
   }
  ]
giving the same result. I used PlotRange here, instead of AxesOrigin, as it gives the same result, and I could move it out of Show.


PlotRangein each of the plots individually, rather than just in theShowcommand. That way, the filling will fill the whole common plot range. – Mark McClure Sep 23 '14 at 13:04AxesOriginthat's causing the issue.Showwill usually combine the plot ranges of the graphics, but it takesAxesOriginfrom the first graphics object. – rcollyer Sep 23 '14 at 13:08AxesOrginto be the same throughout. – Mark McClure Sep 23 '14 at 13:12Showmanages to do by itself and what it needs some extra hints at. – rcollyer Sep 23 '14 at 13:15