39

RegionPlot will usually generate a large number of tiny polygons for filling the region:

RegionPlot[-1 < x < 1 && -1 < y < 1 && x^2 + y^2 > 4/5, {x, -1.2, 
  1.2}, {y, -1.2, 1.2}, Mesh -> All]

Mathematica graphics

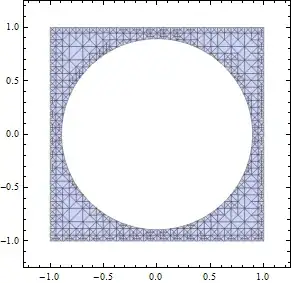
When exported to PDF, these are often not very fast to render.

It is clear that theoretically these polygons could be joined into a single FilledCurve, defined by the outlines only. This should be much faster to render.

How can we do this in a robust way?


Note: the reason we need a FilledCurve and that a plain Polygon will not work is that a FilledCurve can have a hole in it (it may be multiply connected), like in the image above. Alternatively I will accept a solution which uses more than one Polygon, but still reduces the number of Polygonss as much as possible (in the example above two polygons will suffice).


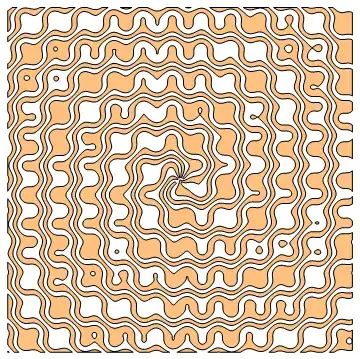
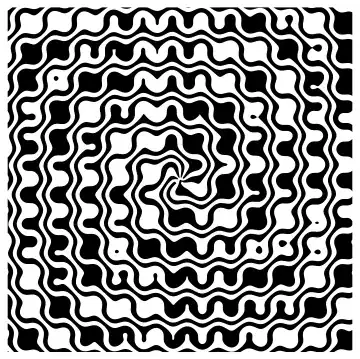
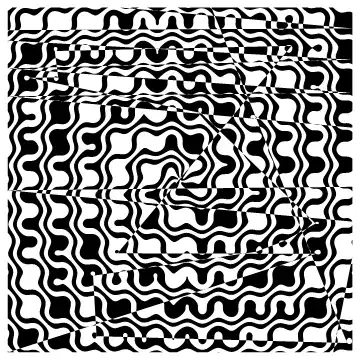
Here's a complex RegionPlot to test on:

a = 36;
g = RegionPlot[
  Mod[Sqrt[x^2 + y^2] - 7/2 ArcTan[x, y] + Sin[x] + 
     Cos[y], π] < π/2, {x, -a, a}, {y, -a, a}, 
  PlotPoints -> 100]

The equation is from here.

Mr.Wizard
  • 271,378
  • 34
  • 587
  • 1,371
Szabolcs
  • 234,956
  • 30
  • 623
  • 1,263

1 Answers1

28

You could start by extracting the Line primitives from the normalized GraphicsComplex:

a=36;

g=RegionPlot[Mod[Sqrt[x^2+y^2]-7/2 ArcTan[x,y]+Sin[x]+Cos[y],Pi]<Pi/2,
 {x,-a,a},{y,-a,a},PlotPoints->100];

lines=Cases[Normal[g], _Line, Infinity];

The lines can then be directly included in a FilledCurve:

Graphics[{
  EdgeForm@Directive[Black, Thickness[Medium]], 
  FaceForm@Directive[Opacity[1/2], Orange], 
  FilledCurve[List /@ lines]
}]

Mathematica graphics

This renders noticeably faster even within Mathematica (for example during resizing).

The structure of the FilledCurve must follow the FilledCurve[{{Line[...]}, {Line[...]}, ...}] pattern in order for the holes to show correctly. Each line must be included in a separate sublist.


If each Line is included in a separate FilledCurve, then the holes will be missing:

Graphics[FilledCurve/@lines]

Mathematica graphics

If we use the FilledCurve[{Line[...], Line[...], ...}] structure, the lines will be effectively concatenated into one continuous line, causing artefacts:

Graphics[FilledCurve[lines]]

Mathematica graphics

Szabolcs
  • 234,956
  • 30
  • 623
  • 1,263
Arnoud Buzing
  • 9,801
  • 2
  • 49
  • 58
  • I used this directly on @Szabolcs plot, and all I got was a blank image. – rcollyer Jan 25 '12 at 03:43
  • @rcollyer - Was that with the Mesh->All setting? Because there are no Line primitives with that setting. – Arnoud Buzing Jan 25 '12 at 03:56
  • Removed Mesh -> All got a black rectangle. – rcollyer Jan 25 '12 at 03:58
  • @rcollyer - In the simpler case this seems to work (but it breaks the more complicated case): Graphics[FilledCurve[lines]] – Arnoud Buzing Jan 25 '12 at 04:05
  • Odd. I'm looking at the forms of both, and I don't understand why Map would work at all. I'll look at it again after I get some sleep. – rcollyer Jan 25 '12 at 04:12
  • That is exactly my problem: I can either fill up the holes, which is incorrect (the Map method), or get many artefacts for reasons I don't understand (the second method). Do you understand why the second method doesn't work generally? We need a simpler test case. – Szabolcs Jan 25 '12 at 09:43
  • 3
    I got it, the solution is FilledCurve[List /@ lines]. Since you're probably sleeping now, I'll edit your answer. Please review the edit, proofread it, and I'll accept afterwards! – Szabolcs Jan 25 '12 at 10:07
  • @Szabolcs - Yes, I think you got it. I could not get this correct myself yesterday. Thanks! – Arnoud Buzing Jan 25 '12 at 15:59
  • 1
    hi guys, is it possible to generalize this code as to automatically maintain the color of the filled areas? i often have a ListContourPlot with 3-4 different colors – Valerio Jun 01 '12 at 13:07