This is a long comment that you can adapt to your situation. The last frame is a way to horizontally align the left and the right parts of the figure using appropriate shifts \sep. The code of all frames/figures is simple, mostly copying and pasting.
Also see the last part of this answer for the cubed power, projection, and squared power.
\documentclass{beamer}
\usepackage{tikz}
\title{$a + b$ whole squared}
%\author{Le Huy Tien}
%\date{May 2022}
\begin{document}
\maketitle
\begin{frame}{What is this ?}
\begin{center}
\begin{tikzpicture}
\def\a{1.5}
\def\b{3.5}
\draw
(\a,0)--(\a,\a+\b) (0,\b)--(\a+\b,\b)
(0,0) rectangle (\a+\b,\a+\b)
;
\end{tikzpicture}
\end{center}
\end{frame}
\begin{frame}{What is this ?}
\begin{center}
\begin{tikzpicture}
\def\a{1.5}
\def\b{3.5}
\colorlet{colora}{cyan!50}
\colorlet{colorb}{yellow!50}
\fill[colora] (0,\b) rectangle (\a,\a+\b);
\fill[colorb] (\a,0) rectangle (\a+\b,\b);
\fill[colora!50!colorb]
(0,0) rectangle (\a,\b) rectangle (\a+\b,\a+\b);
\end{tikzpicture}
\end{center}
\end{frame}
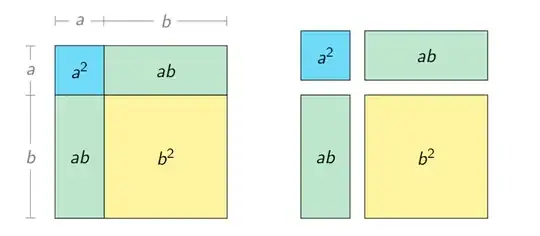
\begin{frame}{$(a+b)^2=a^2+2ab+b^2$}
\begin{center}
\begin{tikzpicture}[nodes={midway}]
\def\a{1.5}
\def\b{3.5}
\colorlet{colora}{cyan!50}
\colorlet{colorb}{yellow!50}
\draw[fill=colora] (0,\b) rectangle (\a,\a+\b) node{$a^2$};
\draw[fill=colorb] (\a,0) rectangle (\a+\b,\b) node{$b^2$};
\draw[fill=colora!50!colorb] (0,0)
rectangle (\a,\b) node{$ab$}
rectangle (\a+\b,\a+\b) node{$ab$};
\draw[|-|,shift={(-.5,0)},gray]
(0,0)--(0,\b) node[fill=white,midway]{$b$};
\draw[-|,shift={(-.5,0)},gray] (0,\b)--(0,\a+\b) node[fill=white,midway]{$a$};
\draw[|-|,shift={(0,.5)},gray]
(0,\a+\b)--(\a,\a+\b) node[fill=white,midway]{$a$};
\draw[-|,shift={(0,.5)},gray]
(\a,\a+\b)--(\a+\b,\a+\b) node[fill=white,midway]{$b$};
\end{tikzpicture}
\end{center}
\end{frame}
\begin{frame}{}
\begin{center}
\begin{tikzpicture}[nodes={midway}]
\def\a{1}
\def\b{2.5}
\colorlet{colora}{cyan!50}
\colorlet{colorb}{yellow!50}
\draw[fill=colora] (0,\b) rectangle (\a,\a+\b) node{$a^2$};
\draw[fill=colorb] (\a,0) rectangle (\a+\b,\b) node{$b^2$};
\draw[fill=colora!50!colorb] (0,0)
rectangle (\a,\b) node{$ab$}
rectangle (\a+\b,\a+\b) node{$ab$};
\draw[|-|,shift={(-.5,0)},gray]
(0,0)--(0,\b) node[fill=white,midway]{$b$};
\draw[-|,shift={(-.5,0)},gray] (0,\b)--(0,\a+\b) node[fill=white,midway]{$a$};
\draw[|-|,shift={(0,.5)},gray]
(0,\a+\b)--(\a,\a+\b) node[fill=white,midway]{$a$};
\draw[-|,shift={(0,.5)},gray]
(\a,\a+\b)--(\a+\b,\a+\b) node[fill=white,midway]{$b$};
\def\sep{.3} % for shifts
\begin{scope}[shift={(5,0)}]
\draw[fill=colora,shift={(0,\sep)}] (0,\b) rectangle (\a,\a+\b) node{$a^2$};
\draw[fill=colorb,shift={(\sep,0)}] (\a,0) rectangle (\a+\b,\b) node{$b^2$};
\draw[fill=colora!50!colorb]
(0,0) rectangle (\a,\b) node{$ab$};
\draw[fill=colora!50!colorb,shift={(\sep,\sep)}]
(\a,\b) rectangle (\a+\b,\a+\b) node{$ab$};
\end{scope}
\end{tikzpicture}
\end{center}
\end{frame}
\end{document}


