Questions tagged [pgfplots]

{pgfplots} is a package for creating 2D and 3D plots of mathematical functions and numerical data, using the PGF graphics framework. For questions about the inbuilt plotting functionality of TikZ/PGF, use {tikz-pgf} instead.

Questions tagged with are about the plotting package of the same name, which uses the PGF graphics framework to create 2D and 3D plots of mathematical functions or numerical data.

The package supports the creation of standard plot types such as scatter plots, line plots, bar/column plots, area plots, and mesh/surface plots, but also of more exotic ones such as comb plots or piecewise constant plots.

The coordinates for the plots can be supplied in the form of mathematical functions using the mathematical engine provided by the PGF framework, by providing coordinates directly in the document, or by reading datafiles from the file system.

Plots created with pgfplots are vector graphics and can thus be scaled without loss of quality. Titles and labels are set as normal text and thus use the same font as the rest of the document, leading to a homogeneous appearance.

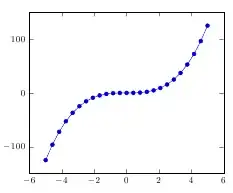
A simple example, plotting the function f(x)=x3:

\documentclass{article}
\usepackage{pgfplots}

\begin{document}
\begin{tikzpicture}
  \begin{axis}
  \addplot {x^3}; 
\end{axis}
\end{tikzpicture}
\end{document}

plot of f(x)=x^3 using pgfplots

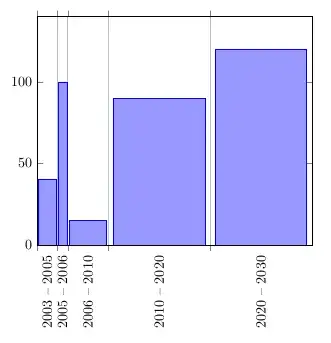
A more advanced example of a bar chart with varying bar widths (taken from the pgfplots manual):

\documentclass{article}

\usepackage{pgfplots}

\begin{document}
\begin{tikzpicture}
\begin{axis}[
    ybar interval=0.9,
    x tick label as interval,
    xmin=2003,xmax=2030,
    ymin=0,ymax=140,
    xticklabel={
       $\pgfmathprintnumber{\tick}$
    -- $\pgfmathprintnumber{\nexttick}$},
    xtick=data,
    x tick label style={
        rotate=90,anchor=east,
        /pgf/number format/1000 sep=}
]

    \addplot[draw=blue,fill=blue!40!white]
        coordinates
        {(2003,40) (2005,100) (2006,15) 
         (2010,90) (2020,120) (2030,3)};
\end{axis}
\end{tikzpicture}
\end{document}

pgfplots ybar interval

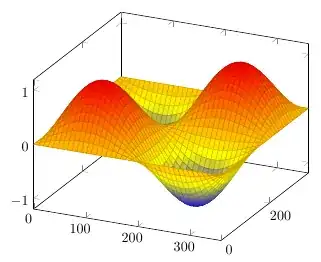
An example of a 3D plot of the function f(x,y)=sin(x)*sin(y) (taken from the pgfplots manual). Note that trigonometric functions in PGF use degrees instead of radians.

\documentclass{article}
\usepackage{pgfplots}

\begin{document}
\begin{tikzpicture}
\begin{axis}
  \addplot3[surf,domain=0:360,samples=40] {sin(x)*sin(y)};
\end{axis}
\end{tikzpicture}
\end{document}

pgfplots 3D plot

9683 questions
61
votes
2 answers

how to keep a 1:1 scale with x and y axis

I have been searching for hours now on how to fix these small problems, and I am finally admitting defeat and humbly ask for help. Lately I have been going over some of my badly drawn figures, trying to clean the up and whatnot. …
N3buchadnezzar
  • 11,348
  • 7
  • 55
  • 114
59
votes
1 answer

Removing x and y ticks in PGFplot

I'm trying to disable the ticks from showing on this diagram: I've tried using x tick=empty as you can see, but it doesn't appear to change anything since I'm not actually plotting in the axis, only using it for easy construction. Any…
Andy
  • 1,363
55
votes
1 answer

How do you remove the axis multiplier?

A chart with data in the range of 200,000 and small difference between max and min values, will be assigned a 10^5 multiplier to the entire axis. This results in the ticks becoming meaningless, since all become 2.…
Phil
  • 675
54
votes
2 answers

How do I change the font size of the axis tick labels in pgfplots?

Surely this question must have been asked before, but I cannot find it and my searches through the user's guide are proving fruitless. I have the following graph: % arara: pdflatex % arara: pdflatex % arara:…
A.Ellett
  • 50,533
51
votes
4 answers

specify the step of pgfplots axis

Now the numbers on the x-axis are 0, 0.5, 1, 1.5, 2 I want to show integer only: 0, 1, 2 How can I do that? My code: \begin{tikzpicture} \begin{axis}[ xlabel=threads, ylabel=speedup & deviation] \addplot table[x=thread,y=speedup]…
WIZARDELF
  • 1,325
  • 3
  • 14
  • 16
49
votes
1 answer

How can I make my pgfplots ylabel multiline?

My pgfplots ylabel text is too long and looks strange. Can I make it multiline?
shino
  • 665
47
votes
4 answers

Axis with trigonometric labels in PGFPlots

How do I make the axis labels use multiples of \pi in PGFPlots?
Regis Santos
  • 14,463
46
votes
2 answers

Label plots in pgfplots without entering coordinates manually

I like to label my plots directly, i.e. without using a legend, but instead using a pin node. So far, I have added the labels with manually specified coordinates, which means trial-and-error for data plots. A better way would be to let TikZ handle…
Jake
  • 232,450
45
votes
2 answers

How can I adjust the position of xlabel and ylabel with pgfplots?

I would like to have \sin x on top of the y-axis' arrow tip and x somewhere on the right of the x-axis' arrow tip. How can I achieve that? On top of that, I would like to know how I can tweak the distances myself. There is 7.4.1 in the manual but…
henry
  • 6,594
44
votes
4 answers

How can I add a zero line to a plot?

I frequently need to draw a horizontal or vertical line passing through the axis origin that spans the entire width or height of my plot area. I don't want to use axis lines=middle, because the tick labels clutter up the plot area. So far, I've been…
Jake
  • 232,450
44
votes
1 answer

Different marker shape for pgf/TikZ

I have a figure in my paper which compared 6 different cases. The figure needs to be in black and white. In below is the code I used to create the figure. \documentclass{standalone} \usepackage{pgfplots} \begin{document} \begin{tikzpicture} …
40
votes
1 answer

pgfplots: two y-axis with three plots and one legend

After googling about my problem, I came up with this two year old question here on TeX.SX. I adopted the example from there having two plots in the first axis-environment and one plot in the second axis-environment as given…
albert
  • 937
36
votes
3 answers

Is there an easy way of using line thickness as error indicator in a plot?

I have several curves/datasets (obtained from Monte Carlo simulations) with x-dependent y errors I would like to plot with the errors somehow indicated. Since each curve consists of quite a large number of data points with rather small errors, using…
Sleort
  • 363
36
votes
3 answers

How can I change place of y label on pgfplots?

I want to change place of ylabel near the axes.
sayros
  • 2,629
35
votes
1 answer

pgfplots - number format on axis

How can I force pgfplots to draw my axis ticks labels consistently? I mean instead of 0 a 0.0, instead of 1 a 1.0 in the below image. EDIT: Code…
DaPhil
  • 3,365
1
2 3
99 100