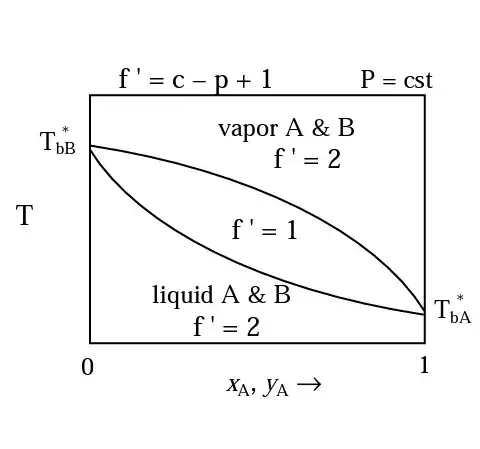
The Gibbs phase rule is $f = c - p + 2$, where $f$ is the degrees of freedom, $c$ is the number of components, and $p$ is the number of phases. Your diagram says $P = \mathrm{cst}$, which I interpret to mean that pressure is constant. That specification lowers the number of degrees of freedom by one, so $f = c - p + 1$.
Inside the "center" region, liquid and vapor phases coexist. Thus there are two phases, and (as with every point on this particular diagram) two components, thus $f = 2 - 2 + 1 = 1$.
Your question is why.
Aren't we able to change the concentration and the temperature at the same[ ]time without changing the [p]hase?
Essentially, no, you can't do that. Inside the center area, liquid and vapor coexist at equilibrium. And -- this is the key point -- that equilibrium is another constraint that lowers the degree of freedom. The compositions of the both the liquid and the phase vapor are not independent of temperature, given the constraint that the liquid is in equilibrium with the vapor.
The composition of the liquid phase will be given by the lower curve. And the composition of the vapor phase is given by the upper curve.
Temperature as the single degree of freedom
So if you decide to use temperature as your (first and only) degree of freedom, then the composition of both the liquid and the vapor is fixed. Say you pick an arbitrary temperature $T_{arb}$, which must obviously be between $T_{bB}$ and $T_{bA}$. This temperature could be represented by a horizontal line on your chart.
The composition of the liquid phase is given by where that horizontal line for $T_{arb}$ intersects the lower curve on your chart. And the composition of the vapor phase is given by where that same line intersects the upper curve.
Thus now that we've specified temperature, the compositions of both phases is also specified, and (given that pressure is constant) thus the system is fully specified. No more degrees of freedom.
(Liquid) composition as the single degree of freedom
Instead of picking a temperature then let's say you pick an arbitrary liquid composition $x_{Aarb}$. Then, given that vapor and liquid are in equilibrium, then the temperature is specified. Your specified $x_{Aarb}$ is a vertical line on your chart. The temperature of the system is given by the value of the ordinate where your $x_{Aarb}$ line intersects the lower curve on the graph.
Now that you know temperature, you can find the corresponding $y_{Aarb}$ by drawing a horizontal line at the newly identified temperature and finding where this horizontal line intersects the upper curve.
Extensive vs. intensive properties
The goal of the Gibbs phase rule is to describe all the intensive degrees of freedom of a system. It doesn't tell you about extensive degrees of freedom. The extensive degrees of freedom tell you "how much" of the system you have. In this system, the extensive degrees of freedom are the absolute amounts of each phase. (The compositions of each phase are intensive properties.) In general for $p$ phases there are $p$ extensive degrees of freedom.
As a simple example, consider a single component system (e.g. pure water) at a constant pressure and in equilibrium with its vapor. The Gibbs phase rule says $f = c - p + 1 = 1 - 2 + 1 = 0$, i.e. that there are no degrees of freedom. But there can be any amount of water, from one picomole to one examole, and the equation is still true. Since there are two phases, there can be one picomole of steam and one examole of liquid water, or vice versa. The Gibbs phase rule isn't going to tell us how much of each phase we have.
The same idea holds in the two-component case that you are asking about. The total amounts of liquid and vapor can vary in the center region. The relative abundance of each phase would be given by the "lever rule" as described in this nice electronic lecture note from the University of Omaha.