It seems to me the spirit of the original context is experimental.
In order to get an analytic answer, even in a simple case with only two rolls, you need to specify precisely how the die is loaded.
Here is a simulation in R of an experiment with $n = 3$ rolls of a die loaded so that
faces 1 to 6 appear with probabilities $(1/12, 1/12, 1/12, 3/12, 3/12, 3/12)$. In practice, such a bias might be achieved by embedding
a heavy weight just below the corner where faces 1, 2, and 3 meet.
A million three-roll experiments are simulated. Each pass through
the loop simulates one three-roll experiment. The random variable
$T$ is the total on the three dice (values between 3 and 18, inclusive).
For the mean and SD of the best-fitting normal distribution, you should be able to
find $E(T) = 12.75$ and $SD(T) = ?$, which are approximated in the simulation. (Also, the exact computation is shown for
$E(T) = n\sum_{i=1}^6 ip_i.$)
 m = 10^6;  n = 3;  p = c(1, 1, 1, 3, 3, 3)/12
 t = numeric(m) # vector to receive totals
 for (i in 1:m) {
   faces = sample(1:6, n, repl=T, prob = p)
   t[i] = sum(faces)  }
 mean(t);  sd(t)
 ## 12.74981  # Approx E(T) = 12.75
 ## 2.657790  # Approx SD(T)
 hist(t, br=(2:18)+.5, prob=T, main="Sum of 3 Rolls", col="wheat", ylim=c(0,.15))
 curve(dnorm(x, mean(t), sd(t)), lwd=2, col="blue", add=T)
 3*sum((1:6)*p)
 ## 12.75     # Exact E(T)
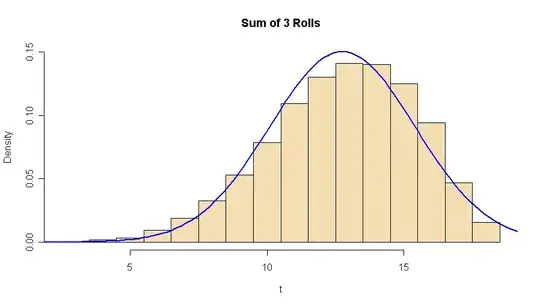
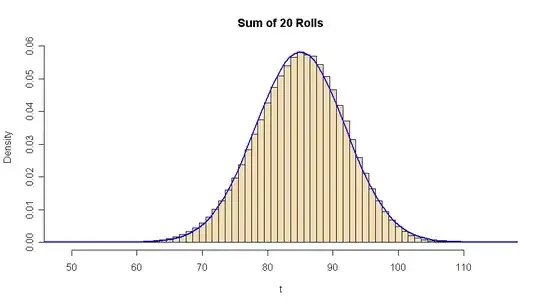
The normal curve with matching mean and SD is not yet a good
fit for only three rolls. Perhaps much better for 20.
Using code $mutatis\;mutandis$: Yes 20 looks better.