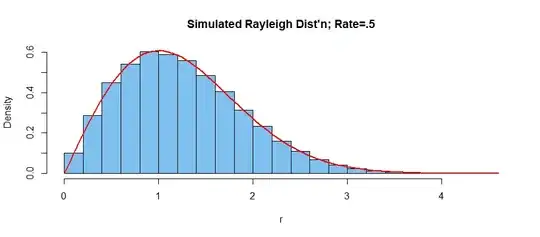
Comment: Using R to sample $n=100,000$ observations from
$\mathsf{Exp}(rate = .5)$ in order to illustrate @MostafaAyaz's (+1) Rayleigh
density function [red curve].
y = rexp(10^5, .5);  r = sqrt(y)
hist(r, prob=T, col="skyblue2", main="Simulated Rayleigh Dist'n; Rate=.5")
curve(2*x*.5*exp(-.5*x^2), add=T, lwd=2, col="red")
Note: The Rayleigh distribution has practical uses. One of them occurs in
the 'Box-Muller transformation' to generate standard two normal random variables
from two uniform random variables. If interested, you can look at Wikipedia pages on
'Rayleigh distribution' and 'Box-Muller transformation' for more information.
