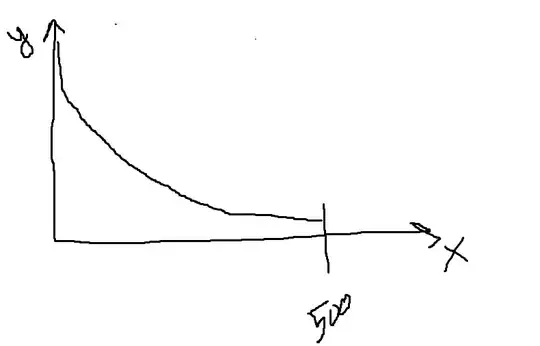
I have data which is exponentially distributed, but my $x$-values are cut off at 500, so there is no tail, and I want to visualise how that tail would look like. How can I do this?
Asked
Active
Viewed 74 times
1
Parcly Taxel
- 103,344
O.Poklev
- 11
-
2What is meant by 'evaluating' a tail? – StubbornAtom Jul 11 '18 at 09:44
-
Can you give me the equation of the distribution? – Chris2018 Jul 11 '18 at 09:45
-
This means that i have some data but it's limited by 500 and there is values greater than 500, which i dont have, so i should evaluate how my distribution will look that part, where x is greater than 500. (therefore i don't have the equation of distribution, i should find it). – O.Poklev Jul 11 '18 at 09:53
1 Answers
1
The question asks for how to visualise the tail of the distribution, which entails estimating its parameters. Since this is exponential, there is one parameter, the rate $\lambda$, which may be estimated from $n$ samples $a_i$ as the inverse of their mean: $$\hat\lambda=\frac n{\sum_ia_i}$$ The plot beyond the cutoff may now be easily drawn by the pdf's formula $\lambda e^{-\lambda x}$.
Parcly Taxel
- 103,344