15

I am not completely sure, but the Moiré pattern on photo's of my screen looks suspiciously like a contour plot of z = xy. I couldn't find any reference or similar question. Is there a fundamental reason for this, or does it seem to be merely a coincidence?

Moiré pattern on my screen: Moiré pattern on my screen

Contour plot of z = xy: Contour plot of z = xy

Ruben
  • 804

2 Answers2

4

The reason is due to slight mismatch of two coordinate systems. For a simple example, suppose we have the usual Cartesian coordinate system and another affine coordinate systems which is slightly off. That is, the points with coordinates $(0,0), (1,0), (0,1)$ are mapped to the same points but the point with coordinates $(1,1)$ is mapped to the point $(1+t,1+t)$ where $t$ is small. But now, the point with coordinates $(x,y)$ is mapped to the point $(x+xyt,y+xyt)$. The point with coordinates $(x,y$) is mapped to $(a+bx+cy+dxy,e+fx+gy+hxy)$ in the most general affine mapping and even more complicated in a general projective mapping, but I deliberately chose a very simple case.

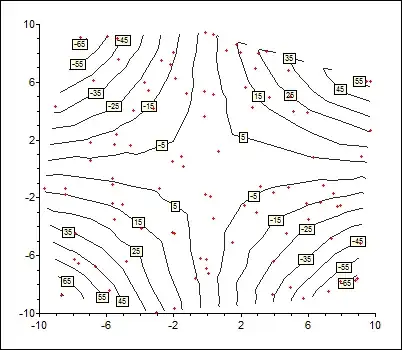
The difference in coordinates is $(xyt,xyt)$. If we assume that $xyt$ is a small fixed quantity based on screen resolution, then $x$ and $y$ are inversely proportional which explains the similarity to a $z=xy$ contour plot.

The photo taken was slightly tilted and not strictly parallel to the plane of the screen. The actual situation here is more complicated due to real world effects such as projective mappings than the simple example I gave, but it essentially has similar features and similar moire effects. This is no "physical effect" but a mathematical and geometrical one as I will now demonstrate.

I tested this effect with some Wolfram Mathematica code:

wc[p1_, w1_, p2_, w2_] := (p1*w1 + p2*w2)/(w1 + w2);
VGrid[L1_, L2_, n_: 1] := 
  Table[Line[{wc[L1[[1]], i, L1[[2]], n - i], 
  wc[L2[[1]], i, L2[[2]], n - i]}], {i, 0, n}];
HGrid[L1_, L2_, n_: 1] := 
  Table[Line[{wc[L1[[1]], i, L2[[1]], n - i], 
  wc[L1[[2]], i, L2[[2]], n - i]}], {i, 0, n}];
HVGrid[L1_, L2_, n_: 1, m_: 1] := 
  Join[VGrid[L1, L2, n], HGrid[L1, L2, m]];

With[{M=60, p1={0, 0}, p2={1, 0}, p3={0, 1}, p4={1, 1}},   
  Graphics[Join[HVGrid[{p1, p2}, {p3, p4}, M, M],
  HVGrid[{p1, p2}, {p3, p4 (1-9/M)}, M, M]], ImageSize->300]]

You can try it yourself at Wolfram Development Platform by creating a new notebook. The Moire pattern image with $t=-9/60$ is this:

Moire pattern

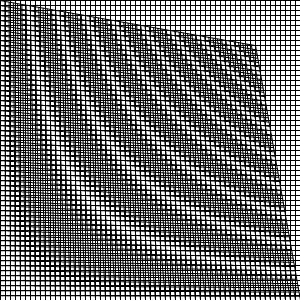
You can see the resemblance to the top right quarter of the screen shot.

Somos
  • 35,251
  • 3
  • 30
  • 76
  • 5
    It's not really clear to me where you get $(x+xyt,y+xyt)$ here. It seems to be pulled out of a hat to match the effect you're ostensibly explaining. Which "physical" effect would lead to that kind of mapping? – hmakholm left over Monica Dec 29 '18 at 15:45
  • I think that a bilinear transform is less natural than a projective transform which would be here, to be in good matching with your own transform : $X(x,y)=(ax/(x+y+a-1)),Y(x,y)=(ay/(x+y+a-1))$ with $a=5$ or so... – Jean Marie Dec 30 '18 at 23:52
  • @JeanMarie Thank you for mentioning projective transform. The whole idea behind projective geometry was to deal with creating flat images of 3D scenes with proper "perspective". I agree it would be more a bit more natural and accurate to take perspective into account, but I decided here it would be more practical and better to go for simplicity instead. – Somos Dec 31 '18 at 04:35
0

Interference occurs when there are two rectangular grids.. One sees the phenomenon in window curtains, green house and fishing nets thin textiles &c. The grid lines can be either continuous or discrete with dots.

A screenshot of computer screen on a mobile camera I could observe several Moiré fringes similar the one in question depending on relative orientations of cameras and their relative out-of-flatness, we need to zoom a couple of times Control+.

Moiré  Fringe

Without going much into geometric quantitative Physics detail the Moire fringe locus is in principle the same as Newton's Ring locus for a coarser wavelength/grid size scale.

Due to the path length difference in Moire Fringes & Newton's Rings both have formation of fringes typical of 1) elliptic 2) saddle 3) flat relative level topographies.

The fringes also reflect Dupin's indicatrices in differential geometry revealing positive, negative and zero Gauss curvatures.They give rise to a family of ellipses/hyperbolae/straight lines respectively.

A path difference of the given image is produced when One of the transparent reticulated plate/dot junction grids ( in optics .. zone plates) are closest/farthest along NorthEast-SouthWest directions compared to NorthWest-SouthEast direction for constant $ z= xy$ fringes. When the plates are carefully rotated by $ 45^{\circ},$ the high features shift to NorthSouth-EastWest for constant $z= x^2-y^2$ fringes.

Narasimham
  • 40,495
  • 1
    How does any of this have to do with a digial screen shot taken by a digital camera? There are no "zone plates" involved here. There was no "carefully rotated ty $45^{\circ}$". – Somos Dec 30 '18 at 01:05
  • Interference is possible when there are two rectangular grids.. one is a raster of tiny pixels on the screen and the other is a raster of the camera screen. I have also obtained the same image. You can also obtain it. Shall upload it later and find the suitable conditions for a snap. – Narasimham Dec 30 '18 at 04:46
  • @Somos Small rotation ok, not necessary through $ 45^∘ $ – Narasimham Jan 05 '19 at 07:26