I am trying to graph a trig function in WolframAlpha. I want the x axis to show radians. It will do this for a basic function, such as $y=\sin x$, but for many functions it will just label the x axis from -10 to 10. I have googled this and this is the best I can come up with:
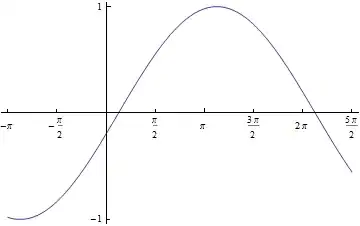
plot sin (x/2 -pi/16) ,Ticks ->{{-pi, -pi/2, 0, pi/2, pi, 3pi/2, 2pi, 5pi/2},{-1,1}}
It doesn't work, WolframAlpha just plots the function from -10 to 10 on the x axis.
TikZor others. – Dominic Michaelis Aug 25 '13 at 15:51