I have managed to import my data into mathematica, but I can't find a way to show the plot the way it was in the lab (Matlab automatically generated file usually show me a graph). Is there a way Mathematica can tell what is in the file and show the graph the way it was in Matlab. Every command (for Matlab) is in the file already.
%********************************************
clear
M=[
% Frequence Amplitude Phase
10 9.359000E+0 1.340000E+0;
11 9.341000E+0 320.000000E-3;
13 9.418000E+0 10.000000E-3;
14 9.405000E+0 -90.000000E-3;
16 9.410000E+0 -70.000000E-3;
18 9.408000E+0 -60.000000E-3;
20 9.407000E+0 -60.000000E-3;
22 9.407000E+0 -60.000000E-3;
25 9.407000E+0 -60.000000E-3;
28 9.405000E+0 -50.000000E-3;
32 9.406000E+0 -60.000000E-3;
35 9.407000E+0 -50.000000E-3;
40 9.405000E+0 -50.000000E-3;
45 9.405000E+0 -50.000000E-3;
50 9.406000E+0 -40.000000E-3;
];
figure (1);
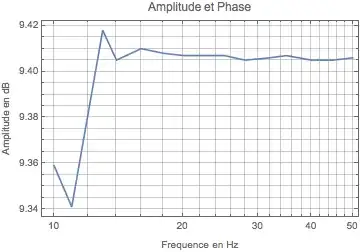
semilogx(M(:,1),M(:,2));
grid;
title('Amplitude et Phase');
xlabel('Frequence en Hz');
ylabel('Amplitude en dB');
of course i skimmed the data but this is my Matlab code.
% second plot
figure (2);

title('Amplitude et Phase');
semilogx(M(:,1),M(:,3));
grid;
xlabel('Frequence en Hz');
ylabel('Phase en degre');
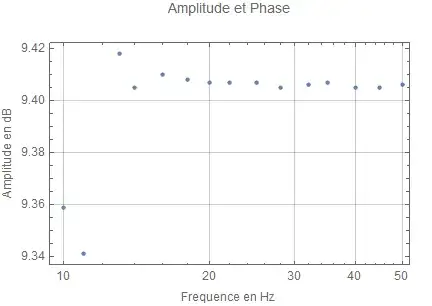

ListLogLinearPlot, which is Mathematica's version ofsemilogxfor sampled data. See alsoListif you're unfamiliar with how to format your data for use inListLogLinearPlot. – IPoiler Jan 21 '16 at 22:24