0

Can someone help in plotting this graph? K is a parameter. Thanks

1 + 1/(4*k^2 + (2*k*Sqrt[t])/Abs[y] e^(-(y^2/(4*k*t))) + 
  Sqrt[k*Pi]*Erf[Abs[y]/(2*Sqrt[k*t])])
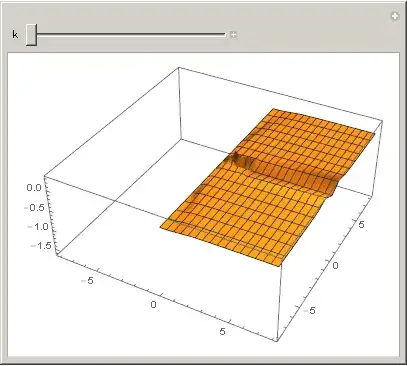
MarcoB
  • 67,153
  • 18
  • 91
  • 189
  • 1
    Note that the basis of natural logarithms should be uppercase E in Mathematica, not e. – MarcoB Jan 25 '16 at 17:31
  • Have you looked at the documentation for Plot? Probably you can make a Table (look it up in the documentation) of these functions, one for each k, and then Plot them. – march Jan 25 '16 at 17:32
  • @MarcoB Thanks, the 'e' was the problem. – user37194 Jan 25 '16 at 17:44
  • Greetings! Make the most of Mma.SE and take the [tour] now. Help us to help you, write an excellent question. Edit if improvable, show due diligence, give brief context, include minimal working examples of code and data in formatted form. As you receive give back, vote and answer questions, keep the site useful, be kind, correct mistakes and share what you have learned. Why not choosing a meaningful username? – rhermans Jan 25 '16 at 17:48
  • Your question may be put on-hold as it seems to be off-topic, i.e it arises from a simple mistake (syntax error, incorrect capitalization, spelling mistake) and is unlikely to help any future visitors, or else it is easily found in the documentation. Don't be discouraged by that cleaning-up policy. Your future good questions are welcome. Learn about common pitfalls here. – rhermans Jan 25 '16 at 17:49

1 Answers1

1
Manipulate[
 Plot3D[
  (4 k^2 + (2 E^(-(y^2/(4 k t))) k Sqrt[t])/Abs[y] + 
    Sqrt[k] Sqrt[π] Erf[Abs[y]/(2 Sqrt[k t])])^-1
  , {t, -8, 8}
  , {y, -8, 8}
  , PlotRange -> Full
  ], {k, -2, 2}]

Mathematica graphics

rhermans
  • 36,518
  • 4
  • 57
  • 149