1

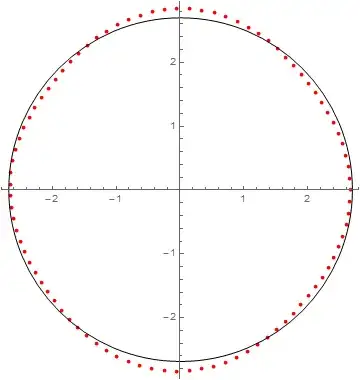
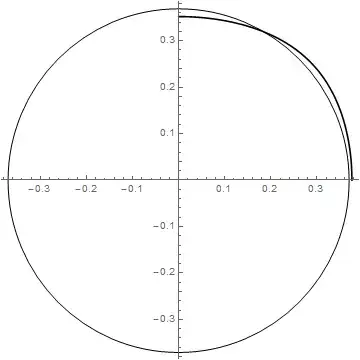
Given a set of data, I have plotted a slowness curve for a p-wave resulting from the given data. A slowness curve is just the reciprocal of the velocity of the p-wave. What I need to do is find a circle of a given radius that will be the 'best fit' or closest circle to the slowness curve, using an optimization of the L2 norm. Basically, I need to minimize the following function:

S=Sum[(y_i-f(x_i))^2,{i,n}]
NMinimize[S,r]

where S is function above and r is the radius of the best fit circle. What I have thus far is:

a = 8.064069;
b = 2.340275;
c = 1.862519;
d = 2.458775;
e = 7.081722;
delta1 = ((a - c)*Sin[Q]^2 - (e - c)*
       Cos[Q]^2)^2 + 4*(c+d)^2*Sin[Q]^2*Cos[Q]^2;
qPa = Sqrt[((e-a)*Cos[Q]^2 + 1a + c + 
      Sqrt[delta1])/2];
plot1a = PolarPlot[1/qPa, {Q, 0, Pi/2}, PlotStyle -> {Black}, 
   AspectRatio -> 1];
plot2a = Graphics[Circle[{0, 0}, 0.37, {0, 2*Pi}]];
Show[plot1a, plot2a]

Mathematica graphics

I'm not familiar with using NMinimize and am stuck with this problem. Would appreciate and welcome any suggestions!!

Sjoerd C. de Vries
  • 65,815
  • 14
  • 188
  • 323
Dee
  • 11
  • 2

1 Answers1

0

This first assumption that I make is that the center of the circle lies at the point (0,0). If this is not the case, see MarcoB's comment from above.

I further assume that you may actually have numerical values for the data and are using a function to simulate your acoustical data.

If you have data that can be used directly. If you have a function then we will make a table of data. Say that we sample the data over 360 degrees, every four degrees.

data = Table[qPa, {Q, 0, 2 Pi, 2 Pi/90}];

All that we need do for the simple case where the center of the circle is at the origin is to take the mean of the data to produce the average radius.

Mean[data]
(* 2.68985 *)

The results look like

Show[
 ListPolarPlot[data, PlotStyle -> Red],
 Graphics[Circle[{0, 0}, 2.68985, {0, 2*Pi}]]
 ]

Mathematica graphics

Jack LaVigne
  • 14,462
  • 2
  • 25
  • 37
  • There is no reason whatsoever that the center of the best-fit circle need be at the mean of the data, as Graphics[ {Point[mydata = Table[{Cos[\[Theta]], Sin[\[Theta]]}, {\[Theta], -.4, .4, .1}]], {Red, PointSize[0.2], Point[Mean[mydata]]}}] shows – David G. Stork Jan 28 '16 at 01:27
  • @DavidG.Stork In the example Mean[data] represents the mean of a list of radii (r1, r2, ..., rn} from the origin rather than the mean of a list of {x,y} points. The funcion qPa yields a radius as a function of angle. – Jack LaVigne Jan 28 '16 at 01:53
  • Yes of course (for your approach). But there is no reason to assume that the center is at the origin. You have not provided a solution to the problem: given a dataset, what circle (center and radius) yields the best fit? – David G. Stork Jan 28 '16 at 01:55
  • @DavidG.Stork You may well be right. The way I read (or possibly mis-read) the question was that the OP was only interested in the radius and the center was assumed to be at the origin. – Jack LaVigne Jan 28 '16 at 02:03
  • Here is the mathematical solution, which someone can implement in code: http://www.emis.de/journals/BBMS/Bulletin/sup962/gander.pdf – David G. Stork Jan 28 '16 at 02:08