1

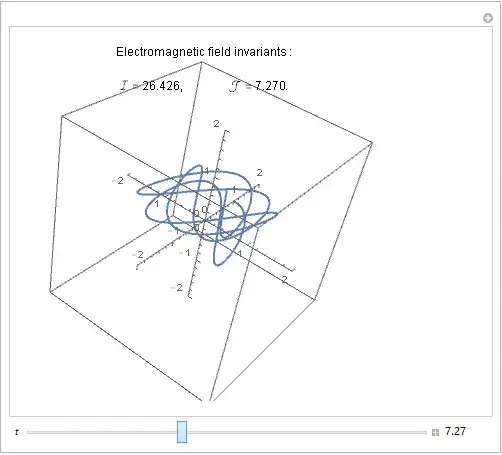
I need to add a string of text with some output data at the bottom-center of a manipulate output. The manipulate output itself is 3D. Here's a MWE to work with :

Manipulate[ParametricPlot3D[
    {Sin[3 s], Cos[5 s], 0.1 s},
    {s, 0.001, t},
    PlotRange -> {{-2, 2}, {-2, 2}, {-2, 2}},
    Axes -> True,
    AxesOrigin -> {0, 0, 0},
    SphericalRegion -> True
    ],
{{t, 0, Style[Row[{t}], Italic, 10]}, 0, 6 Pi, 0.01,
ImageSize -> Large,
Appearance -> {"Labeled", "Closed"}
},
ControlPlacement -> Bottom]

Currently, I defined the text with output as this :

Invariants[t_] := Text[
    Row[{
        "Electromagnetic field invariants :\n\n",
        "\[ScriptCapitalI] = ",
        NumberForm[t^2/2, {12, 3}],
        ",\t",
        "\[ScriptCapitalJ] = ",
        NumberForm[t, {12, 3}],
        "."
    }, BaseStyle -> {FontSize -> 12, 
    FontFamily -> "Helvetica"}], {5, -1.25}
]

I also guess that I need to add this command inside my manipulate code, but it doesn't work :

Epilog -> Invariants[t]

I believe the source of the problem is that the manipulate output is a 3D graphics, while the text I defined would only work on a 2D graphics.

So how should I superpose a few lines of text with data on a 3D graphics, in manipulate ?

Take note : I don't want the text with data to be in 3D. Just a few lines of horizontal text superposed on the 3D graphics.

Cham
  • 4,093
  • 21
  • 36
  • What is the command that generates the 3D output? You will want to share the whole Manipulate code for more meaningful answers. – MarcoB Feb 19 '16 at 15:49
  • Without the full code, I can't generate an answer for your problem, but if you look here there is an example of using Graphics3D[ Text[ _____, coords] ] to place text in 3D graphics at a given point. – Jason B. Feb 19 '16 at 15:51
  • The manipulate code is complicated. I'll try to make a MWE. – Cham Feb 19 '16 at 16:10
  • I've edited the question to add a very simple MWE. – Cham Feb 19 '16 at 16:18

2 Answers2

5

So I would use your text as the PlotLabel, I would remove the Text wrapper, and give the Style option to the plotting function instead,

Invariants[t_] := 
      Row[{
            "Electromagnetic field invariants :\n\n",
            "\[ScriptCapitalI] = ",
            NumberForm[t^2/2, {12, 3}],
            ",\t",
            "\[ScriptCapitalJ] = ",
            NumberForm[t, {12, 3}],
            "."}];

Manipulate[
 ParametricPlot3D[
      {Sin[3 s], Cos[5 s], 0.1 s},
      {s, 0.001, t},
      PlotRange -> {{-2, 2}, {-2, 2}, {-2, 2}},
      Axes -> True,
      AxesOrigin -> {0, 0, 0},
      SphericalRegion -> True, PlotLabel -> Invariants[t],
  BaseStyle -> {FontSize -> 12, FontFamily -> "Helvetica"}],
 {{t, 0, Style[Row[{t}], Italic, 10]}, 0, 6 Pi, 0.01,
  ImageSize -> Large,
  Appearance -> {"Labeled", "Closed"}
  },
 ControlPlacement -> Bottom]

enter image description here

Jason B.
  • 68,381
  • 3
  • 139
  • 286
4
Invariants[t_] := 
 Text[Row[{"Electromagnetic field invariants :\n\n", 
    "\[ScriptCapitalI] = ", NumberForm[t^2/2, {12, 3}], ",\t", 
    "\[ScriptCapitalJ] = ", NumberForm[t, {12, 3}], "."}, 
   BaseStyle -> {FontSize -> 12, FontFamily -> "Helvetica"}], 
  Scaled[{0.5, 0.92}]]
Manipulate[
 ParametricPlot3D[{Sin[3 s], Cos[5 s], 0.1 s}, {s, 0.001, t}, 
  PlotRange -> {{-2, 2}, {-2, 2}, {-2, 2}}, Axes -> True, 
  AxesOrigin -> {0, 0, 0}, SphericalRegion -> True, 
  Epilog -> Invariants[t]], {{t, 0, Style[Row[{t}], Italic, 10]}, 0, 
  6 Pi, 0.01, ImageSize -> Large, 
  Appearance -> {"Labeled", "Closed"}}, ControlPlacement -> Bottom]

Mathematica graphics

Zviovich
  • 9,308
  • 1
  • 30
  • 52