This will give you the ticks you appear to be requesting.
Show[
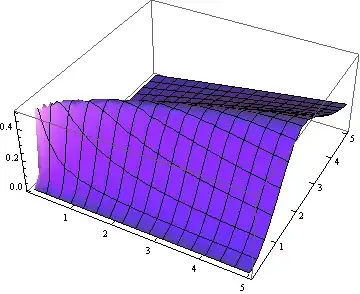
{Plot3D[(x*y^2)/(x^2 + y^4), {x, -5, 5}, {y, -5, 5},
AxesOrigin -> {0, 0, 0},
BoxRatios -> {1.5, 1.5, 1},
Mesh -> 5,
Ticks -> {Range[-5, 5], Range[-5, 5], Automatic},
TicksStyle -> Directive[Blue, Bold, 12]],
Graphics3D[
{Text[Style["x", Bold, 12], Scaled[{1.1, .5, .5}]],
Text[Style["y", Bold, 12], Scaled[{.5, 1.1, .5}]],
Text[Style["z", Bold, 12], Scaled[{.5, .5, 1.1}]]}]},
Boxed -> False]

About the scaling I can't figure out what you are asking. I will note that
Limit[(x*y^2)/(x^2 + y^4), x -> 0]
0
not .5 as you seem to think.
Update
In a 3D plot the usual way to draw attention to a point is place a small sphere on the surface at the indicated xy-coordinates. This is also usually done with plots made with an undistorted Euclidean metric (BoxRatios -> Automatic) to keep the sphere to being distorted.
It is very hard to see the sphere unless it has a diameter of at least 1% of the maximum span of plot. This means the granularity of the visual point space is rather coarse.
Here is what adding such a sphere to your surface looks in an undistorted version.
f[x_, y_] := (x*y^2)/(x^2 + y^4)
Show[
  Plot3D[f[x, y], {x, -5, 5}, {y, -5, 5},
    AxesOrigin -> {0, 0, 0},
    PlotPoints -> 30,
    Ticks -> {Range[-5, 5], Range[-5, 5], Automatic},
    TicksStyle -> Directive[Blue, Bold, 12]],
  Graphics3D[
   {{Red, Sphere[{2., 3., f[2., 3.]}, Scaled[.0075]]},
    Text[Style["x", Bold, 12], Scaled[{1.1, .5, .5}]],
    Text[Style["y", Bold, 12], Scaled[{.5, 1.1, .5}]],
    Text[Style["z", Bold, 12], Scaled[{.5, .5, 1.1}]]}],
  BoxRatios -> Automatic,
  Boxed -> False]

I placed the point at {2, 3} so it us out in the open and easily seen. Note that I also converted the expression you are plotting into a function so the centers of any spheres you would wish to place on the surface can be readily calculated.
Update 2
The point {.01, .1, .5} is indeed on the surface. It is in a region where the surface is ill-behaved, so Mathematica has a hard time drawing there. In fact, when the domain is {x, -.5, .5}, {y, -.5, .5} Mathematica can't show what the region really looks like. To see that part of surface in detail, the domain must be greatly restricted. Even then Mathematica has to work hard.
Here a plot that shows the section you are interested in sufficient detail:
Show[
  Plot3D[f[x, y], {x, -.5, .5}, {y, -.5, .5},
    AxesOrigin -> {0, 0, 0},
    MaxRecursion -> 5,
    PlotPoints -> 200],
  Graphics3D[{Red, Sphere[{.01, .1, f[.01, .1]}, Scaled[.0075]]}],
  BoxRatios -> Automatic,
  Boxed -> False]

Note how the red dot is sitting on a razor sharp ridge, just a bit off from a what appears to be a deep plunge to zero. However, the plunge is an artifact of the plotting process. The ridge actually runs across the x = 0 line, but the inflection becomes so sharp, Mathematica can't show it.
The topography of the region around {.01, .1} makes it hard to plot.