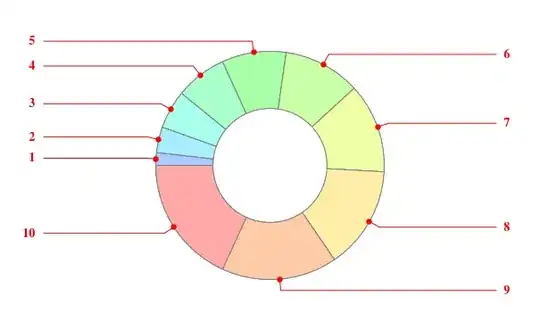
Here is a pie chart with a labels placed with a "VerticalCallout"
PieChart[Range[10],
 PerformanceGoal -> "Speed",
 ChartLabels ->
  Placed[Range[10], "VerticalCallout", Style[#, Red, Bold, 14] &],
 SectorOrigin -> {Automatic, 1}]

I was trying to figure out what, if any, options control the colour and thickness of the "call out" lines and disk. So
Q1. Are there built in options to change this styling?
I was able to alter the styling via a rule replacement:
PieChart[Range[10],
  PerformanceGoal -> "Speed",
  ChartLabels ->
   Placed[Range[10], "VerticalCallout", Style[#, Red, Bold, 14] &],
  SectorOrigin -> {Automatic, 1}] /. {{x_Thickness, _GrayLevel,
    y_Opacity, z__} :> {AbsoluteThickness[1], Red, y,
    z}, {_GrayLevel, _Opacity, Disk[x_List, _]} :> {Red,
    Disk[x, 0.05]}}

But...
Q2. Is there a way to specify the vertical positioning of the labels (for "VerticalCallout"? That is, to specify how far left and right from pie chart that they are positioned?
By default they appear to align at the "image boundary" but if I set image padding or alter the plot range the label positions don't alter.
Edit
ok I have figured out Q2 via rule replacements as well but would still like to know if this can be controlled via built in options.
PieChart[Range[10],
   PerformanceGoal -> "Speed",
   PlotRangePadding -> 0,
   ImagePadding -> 0,
   ImageSize -> 600,
   PlotRange -> {{-4.5, 4.5}, {-4.5, 4.5}},
   ChartLabels ->
    Placed[Range[10], "VerticalCallout", Style[#, Red, Bold, 14] &],
   SectorOrigin -> {Automatic, 1}] /. {Text[x_, {a_, b_}, z_] :>
    Text[x, {a*1.8, b}, z], {x_Thickness, _GrayLevel, y_Opacity,
     z__} :> {AbsoluteThickness[1], Red, y, z}, {_GrayLevel, _Opacity,
      Disk[x_List, _]} :> {Red, Disk[x, 0.05]}} /.
 Line[{{x_, y_}, {z_, y_}}] :> Line[{{x, y}, {z*1.8, y}}]
Traceof your code suggests that the settings are hardcoded. For example, the radius of the disk is set by the value ofCharting‘ChartLabelingDump‘r1$. I tried setting this but could not find a way to change the value used. Incidentally, I found two undocumented labeling options,"Staggered"(same as"RadialOuter") and"CircularUniformFramed". Try:PieChart[Range[10], PerformanceGoal -> "Speed", ChartLabels -> Placed[Range[10], "CircularUniformFramed", Style[#, Red, Bold, 14] &], SectorOrigin -> {Automatic, 1}, ImagePadding -> 20]– Verbeia Sep 22 '12 at 00:24Trace. Looks like "Roger" was the developer based on the large number of "roger" references. :) – Mike Honeychurch Sep 22 '12 at 01:09r$thing by searching forCallout. – Verbeia Sep 22 '12 at 01:16PopoutSpacingandPopout->Truebut I couldn't work out what they did. – Verbeia Sep 22 '12 at 01:22