When we use ListPlot3D or Plot3D in Mathematica, a box is generated to contain the plot, as shown below. In the drawings below, I intentionally did not draw any plot in the box for the sake of clarity and generality; however in my problem I am using ListPlot3D.

I show three axes as they would be generated by e.g. Plot3D[f[x, y], {x, 0, 2}, {y, 0, 3}]].
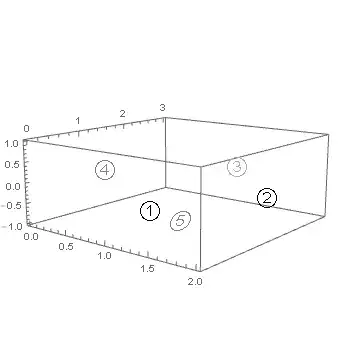
I would like to draw enclosed numbers on the faces of this box at the following coordinates:
① -> {1.5,   0,  0}
② -> {2.0, 1.5,  0}
③ -> {1.0, 3.0,  0}
④ -> {  0, 1.5,  0}
⑤ -> {1.0, 1.5, -1}
Here is a rough approximation of what I would like the end result to look like:


Inset? If your problem is how to get the circle-enclosed numbers, see How to input a number with a ring. – MarcoB Mar 24 '16 at 12:41Framedwith theRoundingRadiusoption. A suitably largeRoundingRadiuswill result in a circled expression. See e.g. http://mathematica.stackexchange.com/q/18823/131 – Yves Klett Mar 25 '16 at 17:20