I'm trying to use Mathematica to create some visual representations of the votes cast in the recent Mathematica-StackExchange moderator elections. (Not the vote-counting system itself, OpenSTV, but rather the choices people made.) This is what I've got so far, but I'm stuck on how to represent the data visually, not knowing much about charting.
According to this Meta post, the results can be downloaded in text form from this page. It looks to be a plain text file (with oddball Unicode characters):
data = Import[
 "https://mathematica.stackexchange.com/election/download-result/1", "Table", CharacterEncoding -> "UTF8"]

(*
{{6, 3}, {1, 1, 2, 3, 0}, {1, 2, 4, 3, 0}, {1, 1, 4, 2, 0}, {1, 3, 1, 5, 0},
.... {"Verbeia"}, {"Mr.Wizard"}, {"F'x"}, {"Eiyrioü von Kauyf"}, {"Mathematica Moderator Election 2012"}}
*)
Although I couldn't find a guide to the format, it looks reasonable to assume that the initial {6,3} is the number of candidates and the number of vacancies, that the strings at the end before the election name are the candidates names, and that the lists starting with 1 and ending with 0 are the individual votes. So:
votes = Cases[data, {1, a_, b_, c_, 0} -> {a, b, c}]
gives the votes:
(*
{{1, 2, 3}, {2, 4, 3}, ... {1, 3, 5}}
*)
which I suppose can be turned into something more readable by picking up the names from the end of the list:
votes1 = votes /.
 Table[
   n -> First@data[[Rescale[n, {1, 6}, {-7, -2}]]],
 {n, 1, 6}]
to give something like this:
(*
{{"R.M.", "J.M", "Verbeia"}, {"J.M", "Mr.Wizard", "Verbeia"},
 {"R.M.", "Mr.Wizard", "J.M"}, {"Verbeia", "R.M.", "F'x"},
 {"Mr.Wizard", "J.M", "Verbeia"}, {"J.M", "R.M.", "Mr.Wizard"} ...
*)
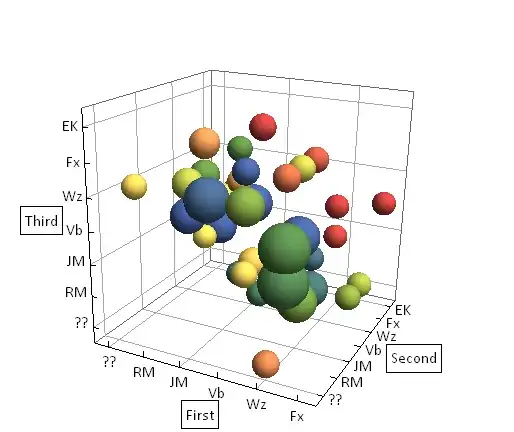
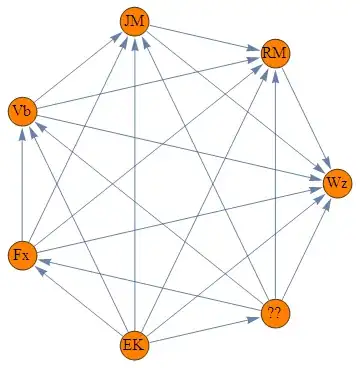
So now I'd like to make this data accessible visually, using charts or graphs. (Or, as the online help says, "produce compelling dynamic visualizations".) How could I do this?