5

http://demonstrations.wolfram.com/HoleInACylinder/

This demonstration uses Graphics3D and is able to generate what I want, but I cant figure out how to separate the simple cylinder plot from the interactive window code. I need to make a simple graphic with specific height, radius, and angle.

Likewise, is there a way to generate such a cylindrical wedge using an integral function with specified bounds to generate a volume? Any help is appreciated, I am brand new to Mathematica and I think this will be quick for someone who knows what they're doing.

Alexey Popkov
  • 61,809
  • 7
  • 149
  • 368

2 Answers2

8

Update: Speaking of "pie slices", you can use SectorChart3D directly as follows:

ClearAll[sliceF]
sliceF[opts : OptionsPattern[]][x_, y_, r_: {0, 2}, h_: 2] := 
 SectorChart3D[{{(y - x) Degree, r[[2]], h}, {(360 - y + x) Degree , 
    r[[2]], h}}, SectorOrigin -> {{x Degree}, r[[1]]}, opts]

sliceF[BoxRatios -> 1, Axes -> True][30, 70]

Mathematica graphics

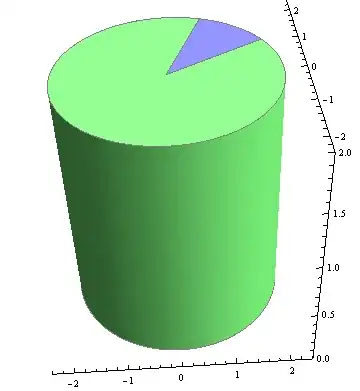
sliceF[BoxRatios -> 1, Axes -> True][30, 70, {1, 2}]

Mathematica graphics

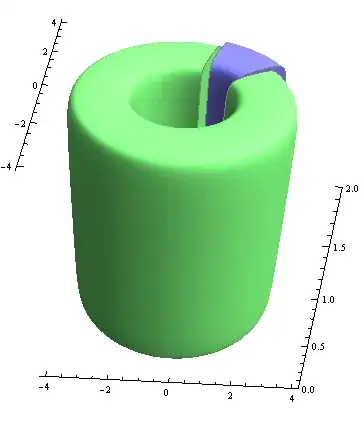
sliceF[BoxRatios -> 1, Axes -> True,  ChartElementFunction -> 
  ChartElementDataFunction["ProfileSector3D", "Profile" -> 5]][30, 70, {3/2, 2}]

Mathematica graphics

Original post:

ClearAll[csF]
csF[opts : OptionsPattern[]][angle_: {0, Pi/2}, radii_: {0, 1}, 
  minmaxheight_: {0, 1}, style_: {EdgeForm[], Opacity[1], Orange}] := 
 Graphics3D[{## & @@ style, 
   ChartElementData["CylindricalSector3D"][{angle, radii, minmaxheight}, 0]}, opts]

csF[][{0, 3 Pi/4}]

Mathematica graphics

csF[Boxed -> False, ImageSize -> 400][{0, 3 Pi/4}, {.5, 1}]

Mathematica graphics

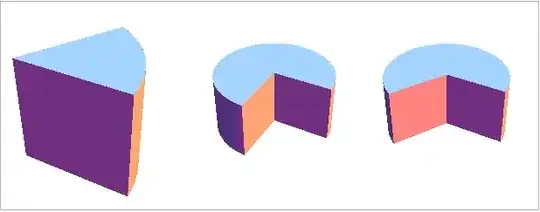
Panel@Row[csF[ Boxed -> False, ImageSize -> 200][{0, #}, {0, 1}, {0, 1}, 
  {EdgeForm[]}] & /@ (Pi {1/3,  3/2, 4/3})]

Mathematica graphics

Panel@Row[csF[ Boxed -> False, ImageSize -> 200][{0, Pi/4}, {#, 1}, {0, 1},
   {EdgeForm[]}] & /@ ({0, 1/3, 2/3})]

Mathematica graphics

Panel@Row[csF[ Boxed -> False, ImageSize -> 200, PlotRange -> {0, 1}][{0, 
      Pi/4}, {0, 1}, {#, 1}, {EdgeForm[]}] & /@ ({0, 1/3, 2/3})]

Mathematica graphics

kglr
  • 394,356
  • 18
  • 477
  • 896
5

See if the following can give you a starting point:

radius = 3; height = 3; angle = 30 Degree;

RegionPlot3D[
  x^2 + y^2 <= radius^2 && x >= 0 && 0 <= y <= ArcTan[angle] x && 0 <= z <= height,
  {x, 0, 4}, {y, 0, 4}, {z, 0, height},
  Mesh -> None, PlotPoints -> 100, 
  PlotRangePadding -> {Scaled[0.05], Scaled[0.05], Scaled[.1]},
  Boxed -> False, Axes -> False
]

Mathematica graphics

MarcoB
  • 67,153
  • 18
  • 91
  • 189