I admit that I am uncertain what the aim is. I post this with the hope that it may prompt correction/clarification with respect to the goal.
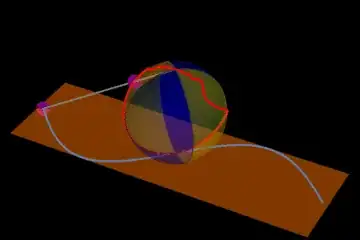
In the following the mesh shading reflects mesh functions y=Sin[x] (the 1 was used to avoid difficulties with 0). Either one certainly would 'cut the sphere' in half (but any great circle could be chosen without the need for Sin[x]). In addition I plot Sin[x] on the x-y plane with corresponding pre-image of stereographic projection from {0,0,2} on the index sphere.
cp = With[{ms = {{Blue, Opacity[0.3]}, {Yellow, Opacity[0.3]}}},
   ContourPlot3D[
    x^2 + y^2 + (z - 1)^2 == 1, {x, -1, 1}, {y, -1, 1}, {z, 0, 2},
    ContourStyle -> None,
    MeshFunctions -> {#2 - Sin[#1] + 1 &, #2 + Sin[#1] + 1 &},
    Mesh -> {{1}, {1}}, MeshShading -> {ms, Reverse@ms}]];
spi[x_, y_] := {4 x, 4 y, 2 ( x^2 + y^2)}/(4 + x^2 + y^2);
anim[t_] := With[{
   s = {t, Sin[t], 0},
   tg = spi[t, Sin[t]],
   p1 = cp,
   pt = ParametricPlot3D[{u, Sin[u], 0}, {u, -Pi, Pi}],
   plane = InfinitePlane[{{0, 0, 0}, {1, 0, 0}, {0, 1, 0}}],
   sin = Table[spi[j, Sin[j]], {j, -100 Pi, 100 Pi, 0.1}]},
  Show[cp, pt,
   Graphics3D[{Orange, Opacity[0.5], plane, Opacity[1], Black, Red,
     Thick, Line[sin], Purple, PointSize[0.04], Point[s], Point[tg],
     Gray, Thickness[0.005], Line[{{0, 0, 2}, s, tg}]}],
   PlotRange -> {{-Pi, Pi}, {-1, 1}, {0, 2}}, Axes -> False,
   Boxed -> False, Background -> Black, BoxRatios -> Automatic]]
The animated gif was created by exporting a sequence with t fron $-\pi$ to $\pi$:

y=Sin[x]withz=0, I get a curve that intersects the sphere at a single point, i.e., {0,0,0}. I think that I am not understanding the question. Here is the code to plot the sphere and line:Show[ ContourPlot3D[ x^2 + y^2 + (z - 1)^2 == 1, {x, -1, 1}, {y, -1, 1}, {z, 0, 2}, ColorFunction -> Function[{x, y, z, f}, {Orange, Opacity[0.2]}]], Graphics3D[{ Thick, Line[Table[{x, Sin[x], 0}, {x, -1, 1, 0.02}]] }] ]– Jack LaVigne Jun 08 '16 at 01:35z == 0* is at odds with the code you have used to plot the graphic. You need to work at re-formatting the question. I suggest you also add the graphic your code produces as an image. You can format inline code and code blocks by selecting the code and clicking the{}button above the edit window. – Jack LaVigne Jun 08 '16 at 12:46