4

I am doing my PhD in Clinical Neuropsychology; I had someone helping me analyse images (.jpg pictures) in Mathematica, but it turns out this person made some really bad decisions, and well, now I have to do it myself. But, I have no idea.

Basically, what I want is to analyze the JPEG image, get a RGB histogram, and get the values for the mean and standard deviation of this histogram.

Using ImageHistogram [[*image*], Appearance, -> "Separated"] works fine, but I can't figure out the next step, turning the histogram plot into numbers.

How can I do that?

Thank you for helping!
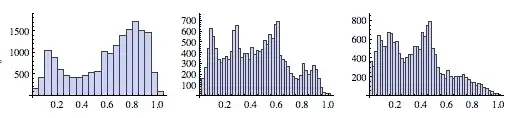
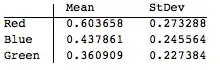
onemonkey
  • 81
  • 1
  • 6

2 Answers2

7

There is one suggestion.

img = ExampleData[{"TestImage", "Lena"}];
imgChannelsRGB = Transpose@Flatten[ImageData[img], 1];

Creating Histogram:

GraphicsRow[Histogram /@ imgChannelsRGB, ImageSize -> 500]

enter image description here

Geting statistics:

TableForm[Through[{Mean, StandardDeviation}[#]] & /@ imgChannelsRGB, 
 TableHeadings -> {{"Red", "Blue", "Green"}, {"Mean", "StDev"}}]

enter image description here

Murta
  • 26,275
  • 6
  • 76
  • 166
  • Alternatively: imgChannelsRGB = Flatten /@ ImageData[img, Interleaving -> False]. The Lenna example image is easily accessed as ExampleData[{"TestImage", "Lena"}]. – J. M.'s missing motivation Oct 12 '12 at 14:00
  • Nice tip. Changed the example. – Murta Oct 12 '12 at 14:03
  • Am trying it right now! – onemonkey Oct 12 '12 at 14:09
  • O wow, this is very promissing! I'm going to play with this (and then I might be back). Thnx! – onemonkey Oct 12 '12 at 14:43
  • You could use ImageData[img] ~Flatten~ {{3}, {1, 2}} in place of Transpose@Flatten[ImageData[img], 1], eliminating Transpose. – Mr.Wizard Oct 12 '12 at 15:19
  • Hi @Mr.Wizard, nice tip, but i think it makes the code really difficult to read. Few people understands Flatten matrix argument (explained in http://mathematica.stackexchange.com/questions/119/flatten-command-matrix-as-second-argument) – Murta Oct 12 '12 at 15:51
  • @Murta -- I hoped my comment would help people learn that syntax but I agree with your choice to use Transpose in the answer. – Mr.Wizard Oct 12 '12 at 17:12
3

I thought it might be interesting to combine the graphs and statistics in small multiple style, but I got stuck... How do you present two numbers as a label without showing the curly brackets?

small multiple

Code:

{r, g, b} = ColorSeparate[img];
Row[
 Labeled[
    ImageHistogram[#, Appearance -> "Transparent",  Joined -> False, 
     Frame -> None],
    {
     Mean[Flatten[ImageData[#]]],
     StandardDeviation[Flatten[ImageData[#]]]
     },
    ImageSize -> 200
    ] & /@ {r, g, b}
 ]

Edit with bill (?!)'s suggestion:

GraphicsRow[
 Labeled[
    ImageHistogram[#, Appearance -> "Transparent", Joined -> False, 
     Frame -> None],
    Style[
     Column[
      {
       Mean[Flatten[ImageData[#]]],
       StandardDeviation[Flatten[ImageData[#]]]
       }
      ], 
     14, Bold], 
    ImageSize -> 500
    ] & /@ {r, g, b}]

better small multiple

cormullion
  • 24,243
  • 4
  • 64
  • 133
  • 1
    Maybe add a Column ? Row[Labeled[ ImageHistogram[#, Appearance -> "Transparent", Joined -> False, Frame -> None], Column[{Mean[Flatten[ImageData[#]]], StandardDeviation[Flatten[ImageData[#]]]}], ImageSize -> 200] & /@ {r, g, b}] – b.gates.you.know.what Oct 12 '12 at 19:26
  • @b.gatessucks Good idea! As usual, your comments are better than my answers! :) – cormullion Oct 12 '12 at 19:30
  • Wow! I have been getting some help from a friend, and we will definitely come back to this! – onemonkey Oct 15 '12 at 09:46
  • OK, so we are on a roll, but now I have a new, buyt related qustion. Should i post it here or open a new topic? – onemonkey Oct 19 '12 at 08:54