3

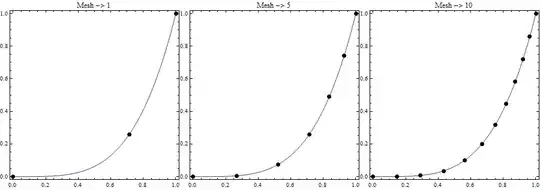
How to make the points on a graph equispaced?

x = Table[{ξ, ξ^4}, {ξ, 0, 1, 0.01}];
Δx = Differences[x];
Δl = Norm[#] & /@ Δx[[ ;; ]];
s = Flatten@{0, Accumulate[Δl]};
l = s[[-1]];
xint = {Interpolation[{s, x\[Transpose][[1]]}\[Transpose]], 
   Interpolation[{s, x\[Transpose][[2]]}\[Transpose]]};
Show[
 ListLinePlot[x],
 ListPlot[{xint[[1]][#], xint[[2]][#]} & /@ 
   Table[ξ, {ξ, 0, l, l/10}]],
 AspectRatio -> 1/GoldenRatio, Frame -> True, PlotRangePadding -> 0
 ]

enter image description here

With the above code I'm considering just equispaced points in the "geometric" space, but in the graph they are not, since I should include the contribution of the axis and the aspect ratio in the sampling.

Does anyone faced this problem before?

Kuba
  • 136,707
  • 13
  • 279
  • 740
Fabio
  • 1,357
  • 6
  • 13
  • its not really clear what you want, but I think essentially you simply need to change Norm[#] to whatever distance metric you need, ( Norm[# {GoldenRatio,1}] perhaps ) – george2079 Aug 24 '16 at 19:38

3 Answers3

2

A copy of your code:

x = Table[{ξ, ξ^4}, {ξ, 0, 1, 0.01}];
Δx = Differences[x];
Δl = Norm[#] & /@ Δx[[ ;; ]];
s = Flatten@{0, Accumulate[Δl]};
l = s[[-1]];
xint = {Interpolation[{s, x\[Transpose][[1]]}\[Transpose]], 
   Interpolation[{s, x\[Transpose][[2]]}\[Transpose]]};

If we make a table of the XY pairs

tableXY = {xint[[1]][#], xint[[2]][#]} & /@ Table[ξ, {ξ, 0, l, l/10}]

(* {{0., 0.}, {0.160018, 0.000655661}, {0.319654, 0.0104405},
   {0.474059, 0.0505046}, {0.608027, 0.136676}, {0.712369, 0.257525},
  {0.793057, 0.395566}, {0.857941, 0.541788}, {0.912171, 0.692317},
  {0.958872, 0.845361}, {1., 1.}} *)]

Take the difference and apply Norm

tableXYD = Differences@tableXY;

Norm[#] & /@ tableXYD

(* {0.16002, 0.159936, 0.159518, 0.159288, 0.159662, 0.159893, \
0.159972, 0.159999, 0.16001, 0.160015} *)

shows that you have succeeded in getting the distances approximately equal.

In order to plot it with equal distance set the AspectRatio to 1.

Show[
 ListLinePlot[x],
 ListPlot[
  {xint[[1]][#], xint[[2]][#]} & /@ Table[\[Xi], {\[Xi], 0, l, l/10}],
  PlotStyle -> {Black, PointSize[0.03]}
  ],
 AspectRatio -> 1,
 Frame -> True,
 PlotRangePadding -> 0.02
 ]

Mathematica graphics

If you want an aspect ratio other than one and want the graph to appear to have equal distance you will have to develop an algorithm to compensate for the aspect ratio (should not be too difficult).

Jack LaVigne
  • 14,462
  • 2
  • 25
  • 37
  • as suggest by george2079 a straightforward though partial solution is given by adding a scale to the Norm[], that is Norm[# {1, 1/GoldenRatio}] & /@ [CapitalDelta]x[[ ;; ]];. However this is valid when the graph has 1:1 axis, as in the solution you have proposed. below I post a more "general" solution. – Fabio Aug 25 '16 at 07:02
2

You can also use MeshFunctions->{"ArcLength"}

ListLinePlot[x, MeshFunctions -> {"ArcLength"}, Mesh -> #, MeshStyle -> PointSize[Large], 
 AspectRatio -> 1, Frame -> True, ImageSize -> 300, PlotLabel -> Row[{"Mesh -> " , #}]] /. 
 ll_Line :> {ll, PointSize[Large], Black, Point[ll[[1, {1, -1}]]]} & /@ {1, 5, 10} // Row

Mathematica graphics

kglr
  • 394,356
  • 18
  • 477
  • 896
0

This should be ok also when the axis are not 1:1 in scale (not the aspect ratio but the axis scale, I mean)

xmax = 2;
ymax = 3;
ar = 1/3;
np = 10;
x = Table[{ξ, ymax (ξ/xmax)^4}, {ξ, 0, xmax, 0.01}];
Δx = Differences[x];
Δl = 
  Norm[# {1/xmax, ar/ymax}] & /@ Δx[[ ;; ]];
s = Flatten@{0, Accumulate[Δl]};
l = s[[-1]];
xint = {Interpolation[{s, x\[Transpose][[1]]}\[Transpose]], 
   Interpolation[{s, x\[Transpose][[2]]}\[Transpose]]};
Show[
 ListLinePlot[x],
 ListPlot[{xint[[1]][#], xint[[2]][#]} & /@ 
   Table[ξ, {ξ, 0, l, l/np}], 
  PlotMarkers -> {Graphics[Disk[]], 0.08}],
 AspectRatio -> ar, Frame -> True, PlotRangePadding -> 0
 ]

enter image description here

yode
  • 26,686
  • 4
  • 62
  • 167
Fabio
  • 1,357
  • 6
  • 13