I will assume you are looking to do a ListPlot using a ColorFunction. In the absence of the real data, let's use some fake data.
SeedRandom[42];
data = RandomReal[1, {20, 2}];
It seems to me that this should work,
ListPlot[data, ColorFunction -> (Directive[Opacity[#1], Hue[#2]] &)]

But you can see that it doesn't. That isn't a bug, it's as designed. ColorFunction is only going to be applied to Line objects,
ListPlot[data, ColorFunction -> (Directive[Opacity[#2], Hue[#1]] &),
 Joined -> True]

The documentation gives a hint about how to add colors to the points by using Style,
ListPlot[Evaluate[
  Style[#, Opacity[Last@#], Hue[First@#]] & /@ data]
 ]
But you can see that the opacity is ignored, even though that is accepted syntax for Style (verify by running Text[Style["AbBbCc", Blue, Opacity[.2]]]).
So we are left with creating our own ListPlot using Graphics primitives
Graphics[({Directive[Opacity[Last@#], Hue[First@#]], PointSize[Large],
      Point@#} &) /@ data, Frame -> True]
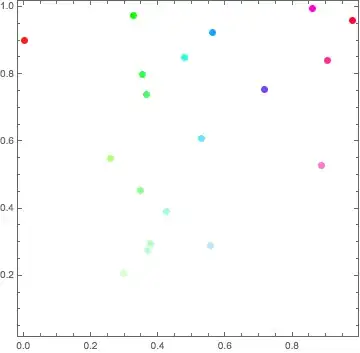
So that works, but it's a pain to use. We can wrap it up into a function via
listColorPlot[data_, colorfunction_: (Hue[#2] &),
  opts : OptionsPattern[]] := Module[
  {colors},
  colors = colorfunction @@@ Rescale[data];
  Graphics[GraphicsComplex[data,
    {PointSize[0.02],
     Thread[{colors, Point /@ Range[Length@data]}]}],
   opts,
   Frame -> True,
   AspectRatio -> 1/GoldenRatio]
  ]
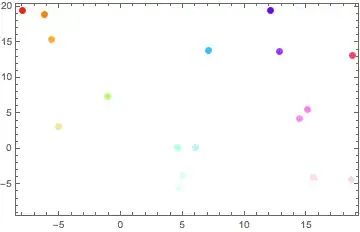
Here is an example of how to run it,
data = RandomReal[{-10, 20}, {20, 2}];
listColorPlot[data, (Directive[Opacity[#2], Hue[#1]] &)]
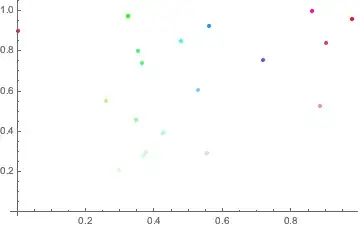
edit
A simple way to do this, from Heike's answer in the duplicate, is to simply apply a replacement rule like
ListPlot[data, ColorFunction -> (Directive[Opacity[#2], Hue[#1]] &),
  Joined -> True] /. Line -> Point
ListPlot? I also don't understand the distinction about real data - you should be able to use the same techniques on real or fake data :-) – Jason B. Aug 26 '16 at 17:45listColorPlotbelow - you'll have to fiddle around with the color function to get it how you want it. It should be a pure function that takes 2 arguments,#1is the x coordinate and#2is the y coordinate. – Jason B. Aug 26 '16 at 19:00