When I make the plot
Plot[-x^2 E^-x^2, {x, -10, 10}, PlotRange -> All]
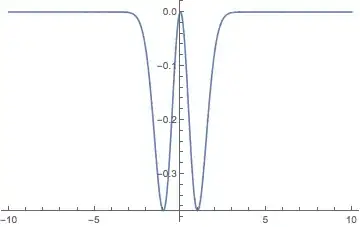
it results in two peaks around {-1, -.34}, {+1, -.34}
But when I specify a vastly expanded plot domain
Plot[-x^2 E^-x^2, {x, -1000, 1000}, PlotRange -> All]

the result looks completely different.
Why does this happen and how do I handle this situation?

PlotPoints– Feyre Aug 31 '16 at 15:03PlotPoints->200does fix the problem, but I do thinkPlotshould be a bit better at sampling functions like this. – Jason B. Aug 31 '16 at 15:04Plotachieve that? What it already does it pretty advanced, I think. What method would you propose to let it discover the interesting region when it is tiny, without making it too slow? It seems to me that its behaviour is quite reasonable here. – Szabolcs Aug 31 '16 at 16:31EvaluationMonitoron this. After the initial sampling of 50 evenly spaced points on{-1000,1000}it samples 27 more points, every one within 2% of the ends. (??) Why on earth would it not resample near the largest spike in the data? – george2079 Aug 31 '16 at 17:30Sin[x]graph in Mathematica." – Alexey Popkov Sep 01 '16 at 07:37Plotwork?" – Alexey Popkov Sep 01 '16 at 07:39