4

How Can I perform a multiple Linear Regression in Mathematica 9 with built-in functions?

(Note that this means multiple independent variables with a single dependent variable. This is distinct from multivariate linear regression, which involves a single independent variable with multiple dependent variables, as asked in this questions.)

For a single variable I can use Fit:

data = Import["myfile","Table"]
line = Fit[data, {1, x}, x]

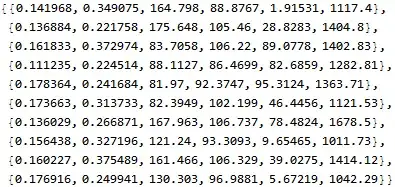
My data looks like this (in the file), but I need to get rid of Indx:

 Indx,  X1,       X2,       X3,      X4,        X5,       Y
 0,   0.1580,   0.3650,  97.7500,  80.0000,   0.5020,  25.4054
 1,   0.1430,   0.4040,  92.0000, 112.5000,   0.6640,   8.1968
 2,   0.1245,   0.4090, 171.5000,  82.5000,   0.7154,  96.1452
 3,   0.1125,   0.1990,  84.7500,  82.5000,   0.7273,  10.8764
 ...

and I need Y = b + m1X1 + m2X2 + m3X3 + m4X4 + m5X5 where b is the intercept and the m's are the coefficients of the X's.

It's pretty straightforward what I need, but I can't figure out how to accomplish this. I tried various forms like:

 linfit = Fit[data, {1, a, b, c, d, e}, {a, b, c, d, e}]

which I had hoped would interpret the different variables as different linear columns of data, but no such luck. It seems to just return the initial data set.

How do I do this in Mathematica 9?

Jess Riedel
  • 1,526
  • 10
  • 25
Gene
  • 97
  • 1
  • 6
  • 2
    The question you reference deals with regression with multiple responses such that given the predictor variables, the response is a vector of values such as {height, width, volume, temperature}. Do you have a single response or multiple responses for the multiple predictor variables? – JimB Sep 14 '16 at 00:34
  • If you do have multiple responses (even the same variable but repeated measurements on the same subject), you should consider using software in R by using Mathematica's RLink functionality. Here's a link as to how to perform such analyses in R: https://socserv.socsci.mcmaster.ca/jfox/Books/Companion/appendix/Appendix-Multivariate-Linear-Models.pdf. – JimB Sep 14 '16 at 01:09
  • I have univariate output Y, and multivariate input X's. I've done this in R, Matlab and Python, but I'm starting down a different road than simple regression, and I need the power of Mathematica for later symbolic calculations. – Gene Sep 14 '16 at 02:58
  • In that case you should follow @JackLaVigne 's answer below. If you need more summary properties (confidence bands, standard errors of estimates, etc.), then NonlinearModelFit will produce those with essentially the same syntax as FindFit. Here's a good summary of the differences between the two: http://mathematica.stackexchange.com/questions/61340/what-is-the-difference-between-findfit-and-nonlinearmodelfit. – JimB Sep 14 '16 at 03:18
  • Thank you, Jim, that's very useful information. – Gene Sep 14 '16 at 03:40

1 Answers1

7

First point is that you need more than four sets of data to get five parameters.

I am going to assume that you have more data and are able to get the data into the form:

{{x11, x12, x13, x14, x15, y1},
 {x21, x22, x23, x24, x25, y2},
  ...
 {xn1, xn2, xn3, xn4, xn5, yn}
}

where n is greater than or equal to five.

I am going to create some synthetic input data

xMatrix = Transpose@{
   RandomReal[{0.1, 0.2}, 10],
   RandomReal[{0.2, 0.4}, 10],
   RandomReal[{80, 180}, 10],
   RandomReal[{80, 110}, 10],
   RandomReal[{1, 100}, 10]
   }

The measured synthetic data is created with known coefficients

yVector = Map[1 + Dot[Range[2, 6], #] &, xMatrix]

They need to be joined to get it in the form mentioned above

data = Map[Join[xMatrix[[#]], {yVector[[#]]}] &, Range[10]]

Mathematica graphics

To fit multivariate data one creates a model and sets the parameters and variables.

FindFit[data, b + m1 x1 + m2 x2 + m3 x3 + m4 x4 + m5 x5,
             {b, m1, m2, m3, m4, m5}, {x1, x2, x3, x4, x5}]

(* {b -> 1., m1 -> 2., m2 -> 3., m3 -> 4., m4 -> 5., m5 -> 6.} *)

Observe that the answer matches the coefficients used to create the synthetic data.

Jack LaVigne
  • 14,462
  • 2
  • 25
  • 37
  • Thank you, this looks excellent! Looks like I was on the right track, but the devil is in the syntax. Does the list of x's always correspond one-to-one with the column of data? So if I have an unused column I can simply ignore it's symbol in the second argument? Does the last column always correspond to the output Y? – Gene Sep 14 '16 at 03:01
  • Oh, and yes, I have much more than 4 rows of data. That was just to show an example of the data. – Gene Sep 14 '16 at 03:14
  • The data input to FindFit or NonlinearModelFit does need to be in the form shown in the answer. If you have a blank column in the data you will need to make a new list. Say for example that you have data columns one through ten that match the desired input form but column five is not used. Then create newData = data[[{1, 2, 3, 4, 6, 7, 8, 9, 10}, All]] and use newData in FindFit. – Jack LaVigne Sep 14 '16 at 14:16