I'll work with FACamargo's photo, since this question has also been asked in the original Q&A.
We begin like for that other photo:
img = Import["https://i.stack.imgur.com/RMQ6U.jpg"];
gray = ColorConvert[RemoveAlphaChannel[img], "Grayscale"];
data = ImageData[gray];
ft = Fourier[data];
ft = RotateLeft[ft, Floor[Dimensions[ft]/2]];
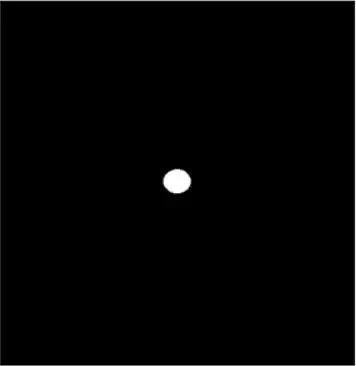
scaled = ft // Abs // Log // Rescale // Image

We see that in this case the information is contained in many different frequencies instead of just a few frequencies. It is therefore much more difficult to extract the interesting signal, but by no means impossible. The method isn't broken; just more difficult to apply.
Like in the other answer we need to filter out the really short frequencies because those frequencies only correspond to the background intensity. They don't correspond to features in the image.
We can see that most of the features in the image can be described by six sets of frequencies, mirrored about the center. An appropriate filter might be this:
mask[r1_, r2_] := With[{d = ImageDimensions[img]},
  Graphics[{
    White,
    Disk[d/2, r2, {Pi/2, Pi/2 + Pi/4}],
    Disk[d/2, r2, {Pi + Pi/2, Pi + Pi/2 + Pi/4}],
    Black, Disk[d/2, r1]
    },
   PlotRange -> {{0, First[d]}, {0, Last[d]}},
   ImageSize -> ImageDimensions[img],
   Background -> Black
   ]
  ]
filtered = ImageMultiply[mask[50, 70], scaled]

Picking out the 20 most high intensity frequencies in this filtered Fourier spectrum, we get
norm = Map[Norm, ImageData[filtered], {2}];
pos = Flatten[Position[norm, #] & /@ TakeLargest[Flatten[norm], 20], 1];

invft = InverseFourier[SparseArray[pos -> 1, Dimensions[ft]] ft];
invimg = invft // Abs // Rescale // Image;
ImageMultiply[img, invimg]

Well... that's not nearly as good as in for the other photo, but some information about the lines is still there.
The main problems are:
- The pattern is weaker in this image, it doesn't stand out as the only significant pattern.
- The information about the pattern is spread out among many different frequencies, not just two frequencies like in the other image. That makes
it more difficult to extract the right frequencies.
I don't know at the moment how to find the right frequencies, but this shows that the approach isn't completely invalidated. It's just more difficult to apply it to this photo.
The Fourier transform of Yode's image looks like it might be even more difficult to extract the right frequencies from.