1

I have a though one. I'd like to project those three data sets on double log scale in 3D as lines having third dimension as a time 0, 1 and 2. I tried overlaying LogLogListPlots, but with no success. The problem is that each data set has a separate x coordinates. Does anybody know a neat solution to my problem?

Best,

JP

J. M.'s missing motivation
  • 124,525
  • 11
  • 401
  • 574
dziakku
  • 301
  • 1
  • 6
  • Welcome to Mathematica.SE! 1) As you receive help, try to give it too, by answering questions in your area of expertise. 2) Take the tour and check the faqs! 3) When you see good questions and answers, vote them up by clicking the gray triangles, because the credibility of the system is based on the reputation gained by users sharing their knowledge. Remember to accept the answer, if any, that solves your problem, by clicking the checkmark sign! –  Oct 28 '16 at 08:40
  • Please provide the code you used so far. Optimally, the data (or a suitable small subset) should be in the question as well. External data may not be permanent and is awkward to use and potentially dangerous. – Yves Klett Oct 28 '16 at 09:00

2 Answers2

1

First download the data, and look at the regular and ListLogLog plots,

data = Partition[
    Transpose[
     Rest@Import[
       "https://www.dropbox.com/s/fxcwyb60hn878qy/sample_dataset.csv?dl=1", "CSV"]], 2] // Map@Thread;

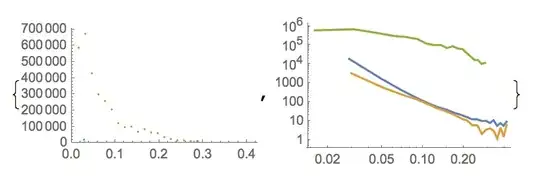
plot1 = ListPlot[data, PlotRange -> {{0, All}, {0, All}}];
plot2 = ListLogLogPlot[data, Joined -> True];
{plot1, plot2}

enter image description here

Next we grab the Line from the plots using the usual method

lines = Cases[plot2, Line[a_] :> a, Infinity];

Here's how I went about inserting a y coordinate in the 3 lists,

lines = MapIndexed[Function[{list, t},
    {#1, Sequence @@ t, #2} & @@@ list], lines];

So now we could have our 3D log-log plot, but it wouldn't have any tick marks. For that we'll use Charting`FindLogTicks, which seems to use a similar syntax to Charting`FindTicks - but here we aren't trying to do any linear rescaling before applying the log transformation, so we give the same argument twice. You grab the original, non-log plotrange

{oldXRange, oldYRange} = Charting`get2DPlotRange[plot1]
(* {{0, 0.422973}, {0, 703545.}} *)

And then use it when making your tick marks. I don't care for 3D Line objects so I'm using Tube here,

Graphics3D[
  Thread[{ColorData[97] /@ {1, 2, 3}, Tube /@ lines}], 
  BoxRatios -> {1, 1, 1}, Axes -> True, 
  Ticks -> {
           Charting`FindLogTicks[oldXRange, oldXRange], 
           Automatic, 
           Charting`FindLogTicks[oldYRange, oldYRange]}
 ]

Mathematica graphics

Jason B.
  • 68,381
  • 3
  • 139
  • 286
0

Pick out actual data points:

dataset = Drop[data, 1];

And then:

Show[Graphics3D@
  Table[{ColorData[1, "ColorList"][[a]], 
    Point@Most@
      ArrayPad[
       ListLogLogPlot[
          Transpose[{dataset[[All, 2 a - 1]], dataset[[All, 2 a]]}], 
          Frame -> False][[1, 1, 2, 1, 2, 3]][[1]], {0, 1}, a]}, {a, 
    3}], PlotRange -> All]

enter image description here

Replacing Point@ with Line@

enter image description here

Feyre
  • 8,597
  • 2
  • 27
  • 46