Why do I get gaps in my plots below? Looking at this post suggests that using Exclusions-> None should fix the problem if there is a discontinuity. However there is no discontinuity in my case. So why do I get the gaps? Using Exclusions-> None does fix the problem so it must be a similar but different problem.
Module[{H, Ha, A = 0.015, α = 4, β, γ = 0.001},
H[β_] := (
E^(-2 π α (I β + γ)) (-I E^(
2 π α (I β + γ)) (β -
I γ) + (I β + γ) Cos[2 π α] -
Sin[2 π α]))/(-1 + β^2 -
2 I β γ - γ^2);
Ha[β_] :=
A (I β + γ)/(1 - (β - I γ)^2);
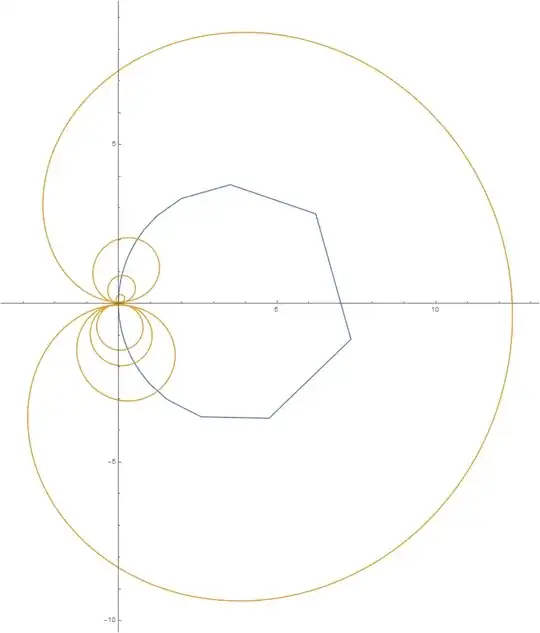
pp = ParametricPlot[{ReIm@Ha[β], ReIm@H[β]}, {β, 0,
2},
ImageSize -> 11 72, PlotRange -> All
]
]
 Note that there is a gap in the yellow curve near the horizontal axis as well as the obvious one in the blue curve.
To look more closely I did
Length@Cases[pp, _Line, ∞]
(* 4 *)
This shows that the blue and yellow curves have been each been split up into two sections. I thought it might be due to the course sampling but increasing the PlotPoints to 200 still leaves a gap in the blue curve.
Now with Exclusions-> None added I get a good result and there are now just two lines as expected.
Module[{H, Ha, A = 0.015, α = 4, β, γ = 0.001},
 H[β_] := (
  E^(-2 π α (I β + γ)) (-I E^(
      2 π α (I β + γ)) (β -
        I γ) + (I β + γ) Cos[2 π α] -
     Sin[2 π α]))/(-1 + β^2 -
   2 I β γ - γ^2);
 Ha[β_] :=
  A (I β + γ)/(1 - (β - I γ)^2);

 pp = ParametricPlot[{ReIm@Ha[β], ReIm@H[β]}, {β, 0,
     2},
   ImageSize -> 11 72, PlotRange -> All, Exclusions -> None
   ]

 ]
So why do I get the gaps?

PlotPoints -> 500makes the plot much smoother. – anderstood Nov 07 '16 at 19:27MaxRecursion -> 10, PlotPoints -> 60, alongExclusions -> None. The function has some strange behaviour at that point which happens not to show up in this particular plot. Mathematica detects and excludes it anyway. Your first function has very rapid change there, thus with uniform sampling in $\beta$ it look ugly and it needs an unusually high number of recursive refinements to smooth it out. – Szabolcs Nov 07 '16 at 19:31PlotPoints -> 200, MaxRecursion -> 10does not do it but then increasing the MaxRecursion to 15 does. What is odd is that in the original plot the yellow curve has a gap despite it being smooth. Is there also an issue with plotting vertically? Thanks for your input. – Hugh Nov 07 '16 at 21:21Show[{ParametricPlot[H],ParametricPlot[Ha]}]so that you can independently set the parameters, – george2079 Nov 08 '16 at 00:43