I will not be able to provide a simple minimum working example here as this seems to be very specific.
I have an interpolating function which I substituted into a PDE and then plot said PDE at a certain time for x and y.
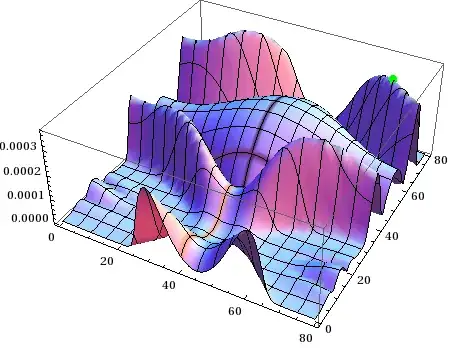
I'd like to find the global maximum of this function. Finding the maximum was described here. However, I find that this just finds the local maximum. As soon as the first maximum value is encountered, the FindMaximum or FindMaxValue are stopped and I don't get the global maximum.
For instance, when I run FindMaximum or FindMaxValue on the interpolating function that generates this:

The local maximum very close to the left bottom corner is returned as 1.7291*10^-6. Obviously the maximum is around 0.00002.
I have attached my .mat files here. The notebook that I use to plot and calculate maximum is as:
$HistoryLength = 0;

Needs["VectorAnalysis`"]
SetCoordinates[Cartesian[x, y, z]];
Needs["DifferentialEquations`InterpolatingFunctionAnatomy`"];
(*Loads the files*)
L = 79.5788;
fileList = FileNames["L_lambda_max_1wl_zg.mat", NotebookDirectory[]];
fileListxy = FileNames["L_lambda_max_1wl_zg.mat", NotebookDirectory[]];
fileListt =
  FileNames["L_lambda_max_1wl_zg_time.mat", NotebookDirectory[]];
datat = Import[fileListt[[1]]];
trup = Max[Flatten[datat]];
tsrup = Ceiling[
   0.9 Flatten[Position[Ceiling[Flatten[datat]], Ceiling[trup]]]];
ts = tsrup[[1]];
dataxy = Import[fileListxy[[1]]];
solution = ListInterpolation[dataxy, {{0, L}, {0, L}, Flatten[datat]}];

(*Plots the data at 0.99 final time*)
Plot3D[
 solution[x, y, 0.99 datat // Flatten // Last], {x, 0, L}, {y, 0, L},
 PlotPoints -> 65]
fac datat // Flatten // Last


(*Defines EqS and plots it and finds the maximum*)
Clear[EqS, EqM]
fac = 0.6;
xg = 0.0
Bi = 1;
Bo = xg 1/300;
K1 = 1;
\[Epsilon] = 10^-6;
\[Delta] = 10^-3;
m = 2*0.025;
r = 0;
EqS = Div[(-h[x, y, t]^3)*Bo*Grad[h[x, y, t]]];


Res[x_, y_, t_] = Abs[EqS /. h -> solution];
EffectofG =
 Plot3D[Res[x, y, fac datat // Flatten // Last], {x, 0, L}, {y, 0, L},
   MaxRecursion -> 2, PlotPoints -> 65, PlotRange -> Automatic]
FindMaxValue[{Res[x, y, fac datat // Flatten // Last], 0 <= x <= L,
  0 <= y < L}, x, y]

(*Defines EqnM, plots it and finds the maximum *)

EqM = Div[m*(h[x, y, t]/(K1 + Bi*h[x, y, t]))^2*Grad[h[x, y, t]]];
Clear[ResM];
EqM;
Bi = 1;
K1 = 1;
\[Epsilon] = 10^-6;
\[Delta] = 10^-3;
m = 2*0.025;
r = 0;
ResM[x_, y_, t_] = Abs[EqM /. h -> solution];
EffectofM =
 Plot3D[ResM[x, y, fac datat // Flatten // Last], {x, 0, L}, {y, 0,
   L}, MaxRecursion -> 2, PlotPoints -> 65]
FindMaxValue[{ResM[x, y, fac datat // Flatten // Last], 0 <= x <= L,
  0 <= y <= L}, x, y]
This was generated using a massive mathematica script and I don't think it would be to many people's interest to run the script for several hours to generate this data. Hence, I just uploaded the data.
Edit:
As per rm-rf's suggestion (see comments) I tried NMaximize with the following change in syntax.
I replaced:
FindMaxValue[{ResM[x, y, fac datat // Flatten // Last], 0 <= x <= L,
  0 <= y <= L}, x, y]
with:
NMaximize[{ResM[x, y, fac datat // Flatten // Last]}, {x, y}]
I find that as I increase the value of fac in my code to say 0.99 times the end time, it gives me a LOCAL maximum instead of a GLOBAL maximum.
FindMaximumalways tries to find only a local maximum, whereasNMaximizeattempts to find a global maximum. Have you tried usingNMaximize/NMinimize? – rm -rf Oct 16 '12 at 22:01NMaximize[{ResM[x, y, fac datat // Flatten // Last], 0 <= x <= L, 0 <= y <= L}, x, y]but it says that only 2 arguments are expected while I furnished 3. I need to furnish the arguments that I have... – dearN Oct 16 '12 at 22:11NMaximizetakes only 2 arguments – rm -rf Oct 16 '12 at 22:12xandyare grouped as{x, y}, whereas you haven't in your call... See the third example for the syntax in the docs. I don't know if it'll work; just a guess. – rm -rf Oct 16 '12 at 22:14NMaximizestill gives me a local maximum. – dearN Oct 16 '12 at 22:16faconce before defining it. If I run your notebook and thenNMaximize[{ResM[x, y, fac datat // Flatten // Last], 0 <= x <= L, 0 <= y <= L}, {x, y}]I get{0.0000113102, {x -> 79.5788, y -> 79.5788}}. – b.gates.you.know.what Oct 16 '12 at 22:32FindAllCrossings2D[]on the appropriate derivatives of the function you want to optimize... – J. M.'s missing motivation Oct 17 '12 at 04:02