I hope this helps at least one person who is in a similar situation. I am trying to create a region (suitable for solving a PDE on) which can be described through a Fourier cosine series in polar coordinates. That is
I used to be able to do this easily through the ParametricRegion command. Now that I am using Mathematica 11, however, I am having difficulty: when I use ParametricRegion with two parameters to create a region in polar coordinates, the region does not display correctly using the RegionPlot command e.g. try the following commands verbatim from the ParametricRegion documentation:
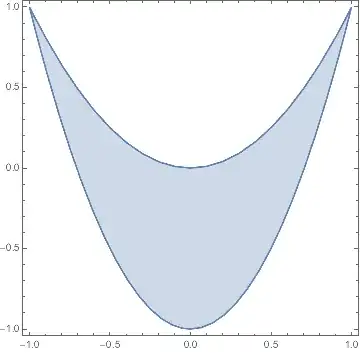
\[ScriptCapitalR] = ParametricRegion[{{s, (1 + t) s^2 - t}, -1 <= s <= 1 && 0 <= t <= 1}, {s, t}];
RegionPlot[\[ScriptCapitalR]]
This code produces the following image:
This is not correct. I assume this is some kind of bug in Mathematica 11, because it worked fine in version 10. Does anyone know another/better way to create such a 2D region in polar coordinates; unfortunately, it is important for my application that I not use a polygonal approximation (the region must be smooth).
Thanks for any help!
DiscretizeRegion[reg]work for you? OrNeeds["NDSolve`FEM`"]; emesh = ToElementMesh[reg]; MeshRegion[emesh]? (FWIW, the mesh regions actually make a polygonal approximation to the region.) – Michael E2 Dec 08 '16 at 03:49it plots over a distorted region (like the one shown above). I suppose I might have to live with it for the time being. Just wondering if anyone has noticed this peculiarity yet.
– PeterH Dec 08 '16 at 03:56ElementMeshPlot3Dmight help. There are three answers in all using this undocumented function on site if you search for them. – Michael E2 Dec 08 '16 at 04:00