Possible Duplicate:
Why does ListPlot ignore some global options?
Using this data:
curve = {{0.833, 0.1}, {0.25, 0.08}, {0.5, 0.15}, {1, 0.2}, {2,
0.3}, {3, 0.45}, {5, 0.75}, {7, 1.25}, {10, 1.85}, {20,
2.55}, {30, 3}};
ListPlot with options set inside show plot markers:
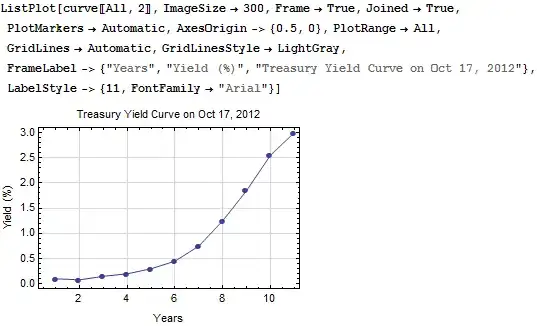
But if I put the exact same options in SetOptions, like this:
SetOptions[ListPlot, ImageSize->300, Frame->True, Joined->True, PlotMarkers->Automatic,
AxesOrigin->{0.5,0}, PlotRange->All, GridLines->Automatic, GridLinesStyle->LightGray,
FrameLabel->{"Years","Yield (%)","Treasury Yield Curve on Oct 17, 2012"},
LabelStyle->{11, FontFamily -> "Arial"}];
The plot markers disappear. I perfer to keep the (relatively unimportant) options out of posts here, showing only the data, plot function, and results. This annoyance thwarts me.
ListLinePlotand corresponding options (minus theJoinedpart). – b.gates.you.know.what Oct 21 '12 at 17:43PlotRangeorAxesOriginaren't inAutomaticit forgets to checkPlotMarkersin the defaults? Blergh – Rojo Oct 21 '12 at 21:06ListPlot[curve, Options@ListPlot]– Mr.Wizard Oct 21 '12 at 21:08PlotRangeorAxesOriginoptions in some creepy way likeDisplayFunction -> ($DisplayFunction@Show[#, AxesOrigin -> {0.5, 0}, DisplayFunction -> Identity] &)and leave the "real" option asAutomatic– Rojo Oct 21 '12 at 21:11