2

I am trying to plot a set of concentric green dashed circles and a green ray.

I was able to produce the desired result using ContourPlot

  b = Range[4, 10, 2]; 

Animate[Show[
      ContourPlot[{x^2 + y^2 == b^2, y = a x}, {x, -10, 10}, {y, -10, 10},
        Axes -> True, 
       ContourStyle -> {Directive[Lighter[Green], Dashed], Darker[Green]},
        PerformanceGoal -> "Quality"], 
      ParametricPlot[{a Cos[\[Theta]], a Sin[\[Theta]]}, {a, 0, 10}, 
       PlotStyle -> Darker@Green]], {\[Theta], 0, 2 \[Pi], 0.01}]

but then I read on the wolfram guide that I should use ParametricPlot to plot the curves so I tried using it but no matter what i do PlotStyle does not change the color of the circles

b = Range[4, 10, 2]
{4, 6, 8, 10}
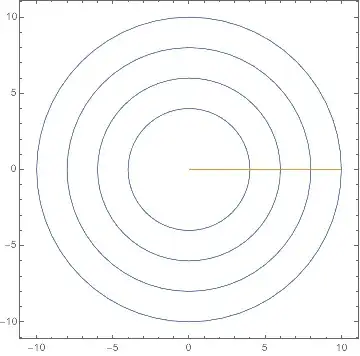
ParametricPlot[{{# Cos[\[Theta]], # Sin[\[Theta]]} & /@ b, {f Cos[0], 
   f Sin[0]}}, {\[Theta], 0, 2 \[Pi]}, {f, 0, 10}, PlotStyle -> Green,
  Axes -> False]

mathematica keeps plotting them blue

what can i do to fix this behavior?

J. M.'s missing motivation
  • 124,525
  • 11
  • 401
  • 574
Alucard
  • 2,639
  • 13
  • 22

1 Answers1

2

The blue (and gold) you see is the boundary of the (empty) areas plotted. (They are indeed areas, i.e., composed of polygons, because you have two parameters θ and f.) So to color the boundary of the areas, too, use BoundaryStyle -> Green.

ParametricPlot[
 {{# Cos[θ], # Sin[θ]} & /@ b, {f Cos[0], f Sin[0]}},
 {θ, 0, 2 π}, {f, 0, 10}, PlotStyle -> Green, 
 Axes -> False]

Mathematica graphics

ParametricPlot[
 {{# Cos[θ], # Sin[θ]} & /@ b, {f Cos[0], f Sin[0]}},
 {θ, 0, 2 π}, {f, 0, 10}, PlotStyle -> Green, 
 BoundaryStyle -> Green, Axes -> False]

Mathematica graphics

But maybe you want something more like this:

Show[
 ParametricPlot[
  {# Cos[θ], # Sin[θ]} & /@ b,
  {θ, 0, 2 π}, PlotStyle -> Green, Axes -> False],
 ParametricPlot[
  {f Cos[0], f Sin[0]},
  {f, 0, 10}, PlotStyle -> Green]
 ]

Mathematica graphics

I'm not sure why the frame disappears, but if you want it, add the option Frame -> True to either the first plot or to Show[].

Or if you just want this specific figure, you could do it the way @J.M. suggests in a comment above.

Michael E2
  • 235,386
  • 17
  • 334
  • 747
  • every once in a while (usually when i don't want to study theory) i make simple gifs with mathematica. it helps me to remember the syntax and the commands. With the figure posted above and a dark background i made a simple animation of a radar, i would like to add the glowing green effect but i think i need to learn more before being able to do this kind of stuff – Alucard Jan 16 '17 at 08:50
  • The glowing effect is not easy. See http://mathematica.stackexchange.com/questions/20855/how-can-i-make-points-glow for instance. – Michael E2 Jan 16 '17 at 11:07