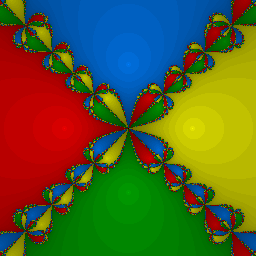
The program that I am currently working with is designed to create the basins of attraction in the complex plane for functions under Newton's Method. Currently, all points that have the same basin of attraction have the same color. I would like to modify the code to that the rate of converge affects the opacity of the basin. As someone who is relatively new to Mathematica, I have been unable to determine how to do so. I imagine that I would have to track some sort of variable through the iteration process and then use it to change a value in the Opacity[a,b] function, I am unsure of how to do that. Any help would be appreciated.
Currently output looks like this. Desired output looks like this.
I believe that the change needs to be made somewhere in these lines of code
op[r_] := 1 - Floor[r/10]/10;
colorlist = {Blue, Red, Yellow, Green,  Cyan, Magenta, Brown, Pink,
   Orange, Purple, Gray, LightRed};
cl[r_] := If[r == 0, Black, colorlist[[Mod[r - 1, 12] + 1]]];
color[r_] := Opacity[op[r], cl[r]];
colortable =
  Flatten[Join[Table[{x -> color[x]}, {x, 0, 100}], {_ -> White}]];
From my understanding of how Opacity works, I would need to change what op[r] is to affect the opacity of the color. I am not sure how to do this without keeping the program producing black for points that do not converge.
Full code:
f[z_] = Expand[z (z^3 - 1)/((z^2 + 1))]; (*function goes here*)
rootlist = x /. NSolve[f[x] == 0, x, WorkingPrecision -> 15]; (*roots of function*)
newt[z_] = Simplify[z - f[z]/f'[z]]
root[z_] :=
  Module[{z0 = z},
   a := NestWhile[newt, z0,
     Abs[#1 - #2] > 10^-8 && Abs[#2] < 1000000 &, 2, 500];
   b = 1;
   While[Abs[a - rootlist[[b]]] > 0.01, b = b + 1;
    If[b > Length[rootlist], Break[]]];
   If[b > Length[rootlist], b = 0]; b];
op[r_] := 1 - Floor[r/10]/10;
colorlist = {Blue, Red, Yellow, Green,  Cyan, Magenta, Brown, Pink,
   Orange, Purple, Gray, LightRed};
cl[r_] := If[r == 0, Black, colorlist[[Mod[r - 1, 12] + 1]]]; (*if point doesn't converge to a root, make it black*)
color[r_] := Opacity[op[r], cl[r]];
colortable =
  Flatten[Join[Table[{x -> color[x]}, {x, 0, 100}], {_ -> White}]];
st = SessionTime[];
numsteps = 250.; (*max number of steps to iterate before not converging*)
cent = .00000000001;
centerx = Re[cent];
centery = Im[cent];
radius = 1.5;
delta = 2.*radius/numsteps;
minx = centerx - radius;
miny = centery - radius;
maxx = centerx + radius;
maxy = centery + radius;
pp = ArrayPlot[
  Table[root[x + I y], {y, maxy, miny, -delta}, {x, minx, maxx,
    delta}], ColorRules -> colortable, ImageSize -> 500]
Print[SessionTime[] - st] (*actual image*)
m = 5;
Plot[{f[z], f'[z], f''[z]}, {z, -m, m}, PlotLegends -> Automatic,
 PlotRange -> {-m, m}, AspectRatio -> 1] (*shows the original function on a domain of m*)