0

I am pretty new to Mathematica. I would like to plot an ellipse:

Fell[x_, y_] := (x + c)^2/a^2 + y^2/b^2 = R^2

where $R$, $a$, $b$ and $c$ have units $m$ and are of the order of $10^6 m$.

However, I couldn't find a command that works. I tried Plot, Solve, Graphics, etc. but got a variety of errors or wrong plot where the frame is shown but not the function.

Can someone tell me, please, how to do that? I am sure it is pretty simple but couldn't find a solution around for two-branches functions with units.

Thx!

p.s. I add a result for the command

ContourPlot[
(Quantity[10^6*x, "Meters"] + c)^2/a^2 +
    Quantity[10^6*y, "Meters"]^2/b^2 ==
R^2/Quantity["Meters"^2],
{x, -10, 10},
{y, -10, 10},
FrameLabel ->
    Normal@QuantityArray[
            ConstantArray[ScientificForm@10^6, 2], "Meters"]
] 

(see suggestion below:

results of the above command

  • ContourPlot but the best be parametric equation and ParametricPlot. – Kuba Mar 12 '17 at 21:40
  • can you please write a working example for this? I tried also ControuPlot but doesn't work
    "ContourPlot[(x/a)^2 + (y/b)^2 == R^2, {x, -R, R}, 
    

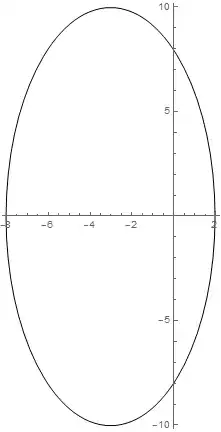
    AspectRatio -> Automatic]"

    gives:

    "ContourPlot::plln: Limiting value -6.3710088*10^6m in {x,-R,R} is not a machine-sized real number."
    
    – user1640950 Mar 12 '17 at 21:44

2 Answers2

2

As Kuba mentioned in the comments you need ContourPlot. Also note that you need == instead of =. The first is a test, the second is an assignment.

R = 1; a = 1; b = 2; c = 3;
ContourPlot[(x + c)^2/a^2 + y^2/b^2 == R^2,
    {x, -10, 10},
    {y, -10, 10}
    ]

enter image description here

And just say all of the constants are in 10^6 m

user1640950 was interested in seeing how this would work with units, which is done via the Quantity interface. Note that if we had different units we'd have to use UnitConvert to get them to align.

{a, b, c} = QuantityArray[{3.2, 2.6, 3}*10^6, "Meters"] ;
R = Quantity[6371, "Kilometers"];

square = 10^8;
ContourPlot[
 (Quantity[x*10^6, "Meters"] + c)^2/a^2 + 
   Quantity[y*10^6, "Meters"]^2/b^2 == 
  R^2/Quantity["Meters"^2], {x, -square, square}, {y, -square, 
  square}, FrameLabel -> 
  Normal@QuantityArray[ConstantArray[ScientificForm@10^6, 2], 
    "Meters"]]

enter image description here

b3m2a1
  • 46,870
  • 3
  • 92
  • 239
  • so, there is no way to plot a function with unit in Mathematica? This sounds strange to me... – user1640950 Mar 12 '17 at 21:55
  • Like a Quantity? – b3m2a1 Mar 12 '17 at 21:55
  • maybe because I used for many years MathCAD, but there you can specify units very easily as soon as you define a physical quantity. This give you automated control on dimensional errors. I understand that this is not obvious in Mathematica.

    Please note I am a newbie on Mathematica. So, I am still pretty confused about it.

    – user1640950 Mar 12 '17 at 21:58
  • Right. You handle units via the Quantity interface. I'll post an example of that. – b3m2a1 Mar 12 '17 at 22:00
  • Thanks a lot for your kind help, but it doesn't work when I parse it.

    The frame appears, but it's empty. I do not know how to post a screenshot of the result. However, the frame is there as expected, R, a, b and c have the expected values and units.

    – user1640950 Mar 12 '17 at 22:46
  • What are the expected values and units? – b3m2a1 Mar 12 '17 at 22:47
  • approximately a = 3.2 e6 m, b= 2.6 e5 m, c=3.3 e6 m, R = 6371 km. I added the plot directly in my questions for you to check. Thanks again for your kind help. – user1640950 Mar 12 '17 at 22:48
  • So that was just a factor of the window not being large enough. I'll replace my other example with this so you can see it. – b3m2a1 Mar 12 '17 at 23:02
  • Thanks! thanks!! thanks!!! Now it works - kudos to MB1965 for the support! Now trying to understand the details... – user1640950 Mar 13 '17 at 11:52
2

One possibility is to use the Circle command. Circle can also plot ellipses.

r=1;
a=1;
b=2;
c=3;
Graphics[Circle[{-c,0},{a r,b r}],Axes->True,AxesOrigin->{0,0}]

Mathematica graphics

r=5;
a=1;
b=2;
c=3;
Graphics[Circle[{-c,0},{a r,b r}],Axes->True,AxesOrigin->{0,0}]

Mathematica graphics

Nasser
  • 143,286
  • 11
  • 154
  • 359