5

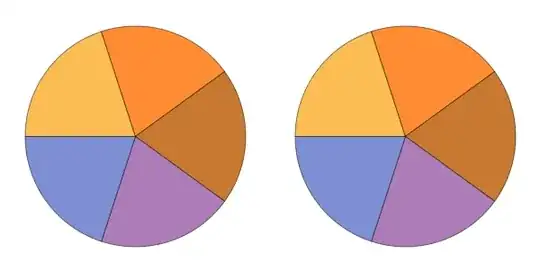
If one increases the number of colored items in a BarChart or PieChart one can see that its color scheme is based on a gradient of some sort:

charts[n_] := Module[
  {data = ConstantArray[1, n]
   , opts = Sequence[
     ImageSize -> Tiny
     , ChartBaseStyle -> EdgeForm[None]
     , PerformanceGoal -> "Speed"
     , ImagePadding -> 0
     , Axes -> False
     ]
   }, {BarChart[{data}, opts], PieChart[data, opts]}
  ]
Column[charts /@ {2, 5, 100}]

Mathematica graphics

Basically, the two colors seen for the case n = 2 are the ends of the gamut. Assigning colors to n > 2 items amounts to picking n - 2 additional colors evenly spaced between these two ends.


I stared for a while at the available gradients looking for one that matched Mathematica graphics, but I can't spot it.


Does anyone know the default color function for these chart types?

kglr
  • 394,356
  • 18
  • 477
  • 896
kjo
  • 11,717
  • 1
  • 30
  • 89
  • 1
    The old colour scheme worked like this: for n = 100; Lighter[#1, 0.66] & /@ Table[Hue[0.6 (1 - i)], {i, 0, 1, 1/(n - 1)}] - ref. Link, but I don't know the formula for the new colours. – Chris Degnen Mar 23 '17 at 21:28
  • 2
    the indexed scheme ColorData[111] resembles those colors, however they are not indexed sequentially to produce a gradient in an obvious way. – george2079 Mar 23 '17 at 21:35

2 Answers2

3

You can use TracePrint and guess that Blend is being used:

TracePrint[charts[2], _Blend, TraceAction->(Print[InputForm[#]]&)]

HoldForm[Blend[Lighter[System`PlotThemeDump`$ThemeDefaultGradient, 0.2], 0.]]

HoldForm[Blend[{RGBColor[0.982864, 0.7431472, 0.3262672], RGBColor[1., 0.544, 0.2], RGBColor[0.784, 0.47519999999999996, 0.2], RGBColor[0.6754608, 0.4848, 0.7224792], RGBColor[0.4992, 0.5552, 0.8309304]}, 0.]]

...

Kuba
  • 136,707
  • 13
  • 279
  • 740
Carl Woll
  • 130,679
  • 6
  • 243
  • 355
3

Confirming @Carl's finding without Trace:

Blend[Lighter[System`PlotThemeDump`$ThemeDefaultGradient, 0.2], #1] &

This is obtained as the setting of the suboption "ChartDefaultStyle" for the default PlotTheme for PieChart:

Charting`ResolvePlotTheme[Automatic, PieChart]
{GridLinesStyle -> Directive[GrayLevel[0.5, 0.4]],   
 LabelStyle -> {GrayLevel[0], FontFamily -> "Arial"},   
 Method -> {"ChartDefaultStyle" ->   
   (Blend[Lighter[System`PlotThemeDump`$ThemeDefaultGradient, 
    0.2], #1] &), "DefaultBoundaryStyle" -> Automatic, 
 "DefaultChartBaseStyle" -> EdgeForm[GrayLevel[0, 0.5]],
"DefaultPlotStyle" -> Automatic}}
System`PlotThemeDump`$ThemeDefaultGradient

Mathematica graphics

% // InputForm
{RGBColor[0.97858, 0.678934, 0.157834], RGBColor[1., 0.43, 0.], 
 RGBColor[0.73, 0.344, 0.], RGBColor[0.594326, 0.356, 0.653099], 
 RGBColor[0.374, 0.444, 0.788663]}

Verifying with a 5-element dataset:

Row[{ PieChart[{1,1,1,1,1}, ImageSize->300], 
   PieChart[{1,1,1,1,1}, ImageSize->300, 
   ChartStyle->Lighter[System`PlotThemeDump`$ThemeDefaultGradient,.2]]}]

Mathematica graphics

J. M.'s missing motivation
  • 124,525
  • 11
  • 401
  • 574
kglr
  • 394,356
  • 18
  • 477
  • 896
  • @Kuba, thank you so much for the edit. Didn't know how to typeset the backticks in code environment. – kglr Mar 23 '17 at 22:47
  • Well, I didn't do this, I only inserted <!-- language: lang-mma --> because something is wrong with highlighting in this topic – Kuba Mar 23 '17 at 22:50