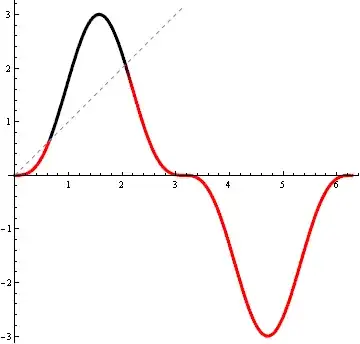
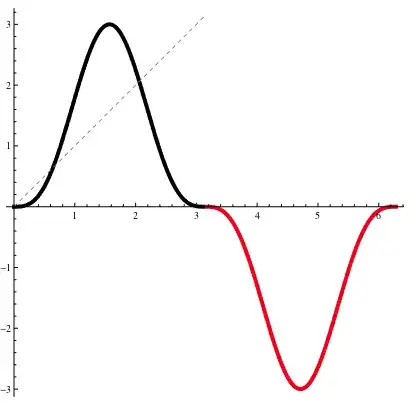
In my code I have a ColorFunction that is meant to highlight all values of $f(x)$ that are greater than $x$
ColorFunction -> (If[#1 >= #2, Red, Black] &)
so that, for example, the parts of the plot of $3\sin^3(x)$ in the figure below that lie above the line $y=x$ should be red, and the parts below, black, but that's not what I get:
What am I missing? I expect I've make some simple (and embarrassing) mistake here, but I'm not seeing it.
Show[
 ParametricPlot[{u, 3 Sin[u]^3}, {u, 0, 2 Pi}, ColorFunction -> (If[#1 >= #2, Red, Black] &),
  PlotStyle -> {Thickness[.01]}, PlotRange -> All],
 Plot[x, {x, 0, Pi}, PlotStyle -> {Gray, Dashed}]]