Disclaimer: I didn't actually look at the links in the comments because I wanted to see how well I could do on my own, so here's my original Mathematica cartogram creation!
First, load the data from various web resources (as is done here):
ClearAll["Global`*"]
usa = Import[
   "http://code.google.com/apis/kml/documentation/us_states.kml",
   "Data"];
popdata =
  Import["https://www.census.gov/geo/reference/docs/cenpop2010/CenPop2010_Mean_ST.txt", "CSV"][[2 ;;, 2 ;; 3]];
popdata = Thread[popdata[[All, 1]] -> popdata[[All, 2]]];
stateabbrev = Import["http://goo.gl/5wC23"][[All, {1, -1}]];
stateabbrev = Thread[stateabbrev[[All, 2]] -> stateabbrev[[All, 1]]];
presresults =
  Import["http://www.fec.gov/pubrec/fe2008/tables2008.xls"];
electoralVotes =
  Thread[presresults[[3, 5 ;; 55, 1]] ->
     Total /@ (presresults[[3, 5 ;; 55, {2, 3}]] /. "" -> 0)] /.
   stateabbrev;
presresults = presresults[[3, 5 ;; 55, {1, 4, 5}]] /. stateabbrev;
transform[s_] := StringTrim[s, Whitespace ~~ "(" ~~ ___ ~~ ")"]

polygons =
  Thread[transform[
     "PlacemarkNames" /. usa[[1]]] -> ("Geometry" /. usa[[1]])];
stateNames = polygons[[All, 1]];
stateNames =
  Extract[stateNames,
   Position[stateNames, x_ /; x != "Alaska" && x != "Hawaii"]];
stateColors =
  Flatten[{#[[1]] -> If[#[[2]] > #[[3]], Blue, Red]} & /@
    presresults];
I'm limiting myself here to the continental US, but the method is general to any collection of boundary data. Now, define some utility functions (borrowed from here):
area[pts_] :=
  Plus @@ (ListCorrelate[{1, 1}, First /@ pts,
       1] ListCorrelate[{-1, 1}, Last /@ pts, 1])/2;
com[pts_] := Module[{moments, thearea},
   moments = (1/6) {
      Plus @@ ((#1^2 + #1 #2 + #2^2 & @@ ({RotateLeft[#], #} &@(First \
/@ pts))) ListCorrelate[{-1, 1}, Last /@ pts, 1]),
      -Plus @@ ((#1^2 + #1 #2 + #2^2 & @@ ({RotateLeft[#], #} &@(Last \
/@ pts))) ListCorrelate[{-1, 1}, First /@ pts, 1]) };
   thearea = area[pts];
   Return@If[thearea == 0.0, Mean[pts], moments/thearea]];
com2[pts_, weights_] := Module[{},
   Return[Total[weights*pts]/Total[weights]]];
And now the meat of it:
origdata = (stateNames /. polygons)[[All, 2 ;;, 1]];
newdata = origdata;
nits = 10;
nstates = Length@stateNames;
weights = (stateNames /. popdata)/Total[stateNames /. popdata];
For[j = 1, j <= nits*nstates(*Length@origdata*),
  i = Mod[j - 1, nstates] + 1;
  tempdata = newdata;
  (*compts=Map[com,newdata,{2}];*)

  polyarrs = Map[area, newdata, {2}];
  statearrs = Total /@ polyarrs;
  allarr = Total@statearrs;
  comall =
   Table[com2[com /@ newdata[[i]], polyarrs[[i]]], {i,
     Length@origdata}];
  norms = Map[Norm[(# - comall[[i]])] &, tempdata, {3}];
  exp = Tanh[Log[1/weights[[i]] statearrs[[i]]/allarr]]/2;
  newdata =
   Map[(# - comall[[i]]) &,
     tempdata, {3}] (1 - exp Exp[-(norms/Max[norms[[i]]])^2]);
  newdata *= Sqrt[
   Total[Total /@ Map[area, tempdata, {2}]]/
    Total[Total /@ Map[area, newdata, {2}]]];
  j++];
plotcolors = stateNames /. stateColors;
Show[Graphics[
  Table[{EdgeForm[Directive[Black, AbsoluteThickness[0.5]]],
    plotcolors[[i]], Polygon[newdata[[i]]]}, {i, Length@newdata}]],
 AspectRatio -> Automatic]
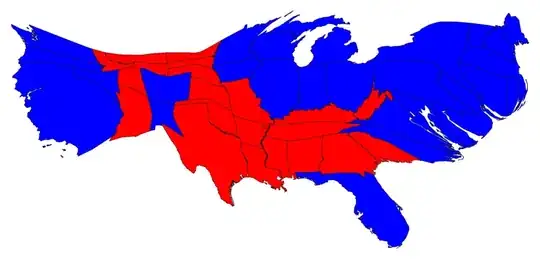
And voila!

The dataset is actually a bit tricky to handle as some of the states are not contiguous (such as the Channel islands), so the center of mass of each state is computed by calculating the centers of mass of each polygon that constitutes a particular state, and then finding the center of mass of the polygons.
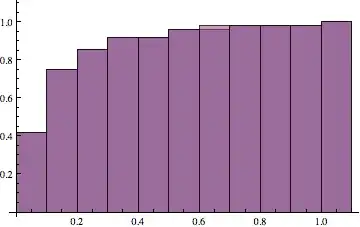
My method of madness here is to simply "push" or "pull" all points in the map towards the center of mass of a particular state, with the amount of pushing or pulling falling off exponentially with distance. The code does this over multiple iterations, only pushing or pulling all the points by a small amount each time, with the amount being determined by the ratio of each state's area to the desired area. The CDF of the state areas as compared to the populations shows that this is a true cartogram (the more iterations, the better it is):
Histogram[{statearrs/Max[statearrs], (stateNames /. popdata)/
  Max[stateNames /. popdata]}, Automatic, "CDF"]
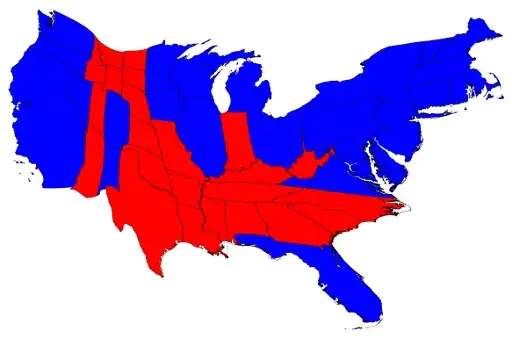
This is for the 2008 presidential results, I couldn't find a machine-readable table of the 2012 results. Here's the map for electoral votes (looks pretty similar):
You can get the electoral vote cartogram by replacing the weights definition above with:
weights = (stateNames /. electoralVotes)/Total[stateNames /. electoralVotes];
Some caveats:
- I'm just going through the list of states alphabetically, but perhaps a more "pleasing" cartogram could be constructed by going through the states in a particular order.
- It's a bit slower than I would like (about 2 minutes to run this).


Tooltip[]with eachPolygon[]for starters... – J. M.'s missing motivation Nov 09 '12 at 09:43ImageTransformationcould be one way.. but no idea on how to implement that! Very cool. – Murta Nov 17 '12 at 16:48