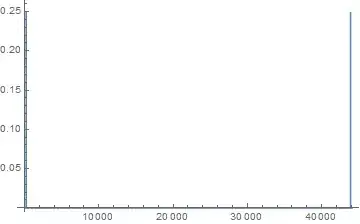
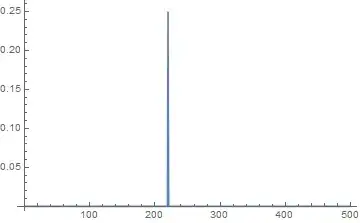
With this code I get a nice plot of the Fourier transform, but the frequencies are doubled. By this I mean that when using a sine wave I generated at 220 Hz, the plot gives me a single peak at 440 Hz. I've tried searching around, but I'm stuck.
 data = Import[
"ExampleFilePath", "Data"];

length = Length[data];

samplerate = 44100;

increment = samplerate/length;

frequency =
Table[f, {f, 0, (samplerate - increment), increment}] //
N;

power = Abs[Fourier[data, FourierParameters -> {-1, 1}]]^2;

powerdata = Transpose[{frequency, power}];
edited to fix link

frequency = Table[f, {f, 0, (samplerate - increment), increment}] // N;is not right. This mistake is not related to Mathematica. – Kattern Apr 26 '17 at 02:13