B[t_] = {
  {i*x_ {1}/2, J_ {1}, 0, g_ {1}*a_ {1}, 0},
  {J_ {1}, i*x_ {2}/2, J_ {2}, -g_ {1}*a_ {2}, g_ {2}*a_ {2}}, {0,
   J_ {2}, i*x_ {3}/2,
   0, -g_ {2}*a_ {3}}, {g_ {1}*a_ {1}, -g_ {1}*a_ {2}, 0, i*y_ {1}/2,
   0}, {0, g_ {1}*a_ {2}, -g_ {1}*a_ {3}, 0, i*y_ {2}/2}
  }
where J_{1}=J_{2}=1/2, a_{3} = 30*Exp[-(t)^2/t_{1}], a_{2}=0, a_{1} = 30*Exp[-(t - t_{0})^2/t_{1}], t_{0} and t_{1} are constant, g_{1} = g_{2}=0.01, x_{i}=y_{i}=0 for simplest case and later may be taken arbitrary.
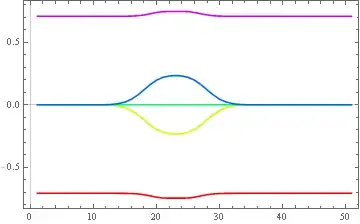
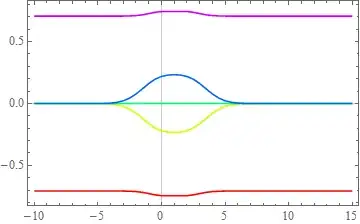
I want to plot the eigenvalues.
I have used following command but axis label is not varying correctly.
data = Table[Eigenvalues[B[t/2]], {t, -10, 15, 0.5}];

ListPlot[Transpose[Sort /@ data], Frame -> True, FrameStyle -> Directive[Black, 12]]
please let me know how can I plot eigenvalues with time t long x-axis and what about if x_{i}=y_{i} are non zeros.