To make nicer PDFs, you could adapt the answer here as follows. Before making any plots, execute the command
Map[SetOptions[#,
Prolog -> {{EdgeForm[], Texture[{{{0, 0, 0, 0}}}],
Polygon[#, VertexTextureCoordinates -> #] &[{{0, 0}, {1,
0}, {1, 1}}]}}] &, {Graphics3D, ContourPlot3D,
ListContourPlot3D, ListPlot3D, Plot3D, ListSurfacePlot3D,
ListVectorPlot3D, ParametricPlot3D, RegionPlot3D, RevolutionPlot3D,
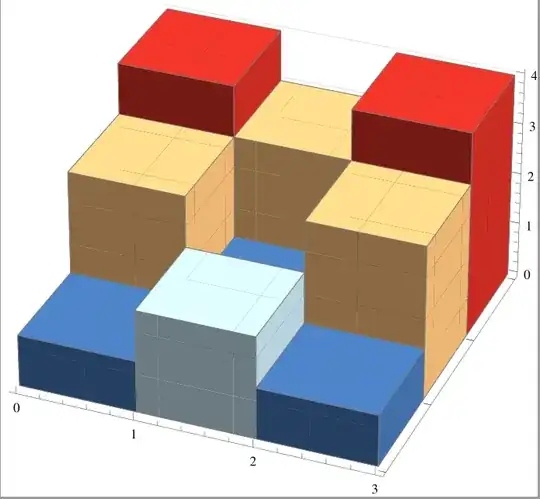
SphericalPlot3D, VectorPlot3D, BarChart3D}];
and then do the BarChart3D. If you export it to PDF now, the process will take a little longer but the output will look nicer, without the lines. The explanation why this works is given in the linked answer. I only modified that trick by appending BarChart3D to the list of functions to which it applies.