Update: We can use the "BoxRange" sub-option of Method combined with the option "IQRCoefficient" in ChartElementDataFunction to get the boxes and fences placed at x StandardDeviation distance below and above the Mean without having to use a custom ChartElementFunction.
The elements of BoxWhiskerChart are determined by the 5 quantiles of the data (namely, Quantile[data, {0,.25, .5, .75, 1}]). The location of the fences are controlled by the option IQRCoefficient that can be specified in the setting of the option ChartElementFunction as in
ChartElementFunction -> ChartElementDataFunction["BoxWhisker", "IQRCoefficient" -> iqr]
so that the lower fence is placed at Quartile[data][[1]] - iqr InterquartileRange[data] and the upper fence at Quartile[data][[3]] + iqr InterquartileRange[data].
One way to base the BoxWhiskerChart elements on the Mean and StandardDeviation (rather than on quantiles) is to use the sub-option "BoxRange" in the Method option of BoxWhiskerChart. This can be done defining
boxRange = Through[{Min, Mean[#] - StandardDeviation[#] &, Mean,
      Mean[#] + StandardDeviation[#] &, Max}@#] &;
and using it as in
Method -> {"BoxRange" -> boxRange}
Combined with the option
ChartElementFunction -> ChartElementDataFunction["BoxWhisker", "IQRCoefficient" -> 1/2]
we will get a box defined by Mean - StandardDeviation and Mean + StandardDeviation (as opposed to a box defined by the first and third quartiles) and fences at 2 StandardDeviation below and above the Mean.
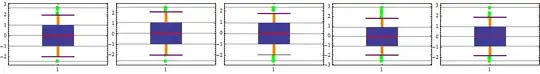
Example:
bwcdata = Table[data[[IntegerPart[m/n]*(i - 1) + 1 ;;  IntegerPart[m/n]*i]], {i, n}];

options = {{{"MedianMarker", 1, None}, {"Outliers", Green},
     {"MeanMarker", 1, Directive[Thickness[.01], CapForm["Butt"], Red]},
     {"Fences", 1, Directive[Thickness[.01], Purple]},
     {"Whiskers",  Directive[Thickness[.025], CapForm["Butt"], Orange]}},
   ChartLabels -> Table[ToString[i], {i, n}], ChartStyle -> 1,
   ChartElementFunction -> ChartElementDataFunction["BoxWhisker", "IQRCoefficient" -> 1/2],
   Method -> {"BoxRange" -> boxRange}};

BoxWhiskerChart[bwcdata, ## & @@ options]

BoxWhiskerChart[#, ## & @@ options, ImageSize -> 200,
    GridLines -> {None, boxRange@#}] & /@ bwcdata // Row
Original post:
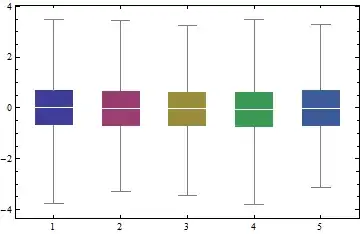
You can use the second argument of BoxWhiskerChart to show the MeanMarker instead of the default MedianMarker.
BoxWhiskerChart[Table[data[[IntegerPart[m/n]*(i - 1) + 1 ;; IntegerPart[m/n]*i]], {i, n}],
 {{"MedianMarker", None}, {"MeanMarker", 1, White}},
 ChartLabels -> Table[ToString[i], {i, n}], ChartStyle -> 1]