3

I have the following piece of code:

Plot[StateResponse[
   nss,
   {0.01 UnitStep[t - tstep], 0, 0, 0, 0}, {t, 0, tstop}] // Evaluate,
 {t, 0, tstop} ,
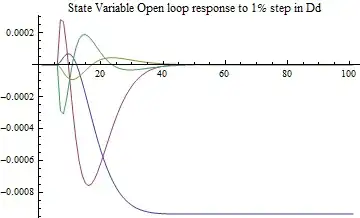
 PlotLabel -> "State Variable Open loop response to 1% step in Dd"]

which gives me a five variable plot.

I want to export this plot to excel to compare with some other data but can't get Export to format the exported Mathematica data as I want, i.e. in six columns.

Can anyone help on this?

halirutan
  • 112,764
  • 7
  • 263
  • 474
dhog
  • 103
  • 4
  • 3
    Welcome to Mathematica! Hello dhog and welcome to the Mathematica StackExchange. It is always best to include a minimal, working example in your question. Users can then copy/paste/try your code and reproduce your problem. – halirutan Dec 03 '12 at 15:58
  • I've a big matrices that needs to be plotted as part of the StateResponse command but I can't copy it in without loosing the Mathematica formatting, is it possible to enter it somehow? – dhog Dec 03 '12 at 16:16
  • 1
    is this Q/A relevant/useful? – kglr Dec 03 '12 at 17:37

1 Answers1

8

If we define your parameters as:

 tstep = .5;
 tstop = 10;
 nss = StateSpaceModel[{
     {{0, 1, 0, 0}, {5.3572, 7.602, 56.6571,18.102}, 
      {0, 0, 0, 1}, {-5.3572, -7.602, -46.8571, -18.102}}, 
      {{0}, {0.5}, {0}, \{-0.5}}}, 
       SamplingPeriod -> None, SystemsModelLabels -> None];

Then store the response as a list:

 response = Table[Evaluate@StateResponse[nss, 
                    {0.01 UnitStep[t - tstep], 0, 0, 0, 0},
                    {t, 0, tstop}], {t, 0, tstop, .1}];
 ListPlot[Transpose@response,
          PlotLabel -> "State Variable Open loop response to 1% step in Dd", 
          Joined -> True]

enter image description here

Which can be exported to xls and plotted in Excel

 Export["temp.xls",response]

enter image description here

David Slater
  • 1,525
  • 10
  • 13