I'm doing an experiment on Zeeman effect, and I have to turn an image into a graphic, like the example below:
![Example of the desired result[1]](https://i.stack.imgur.com/oCWch.png)
What functions available does this image processing?
Thanks in advance,
Gabriel
1 - http://www.ifsc.usp.br/~lavfis/images/BDApostilas/ApEfZeeman/EfeitoZeeman_Davidovich.pdf

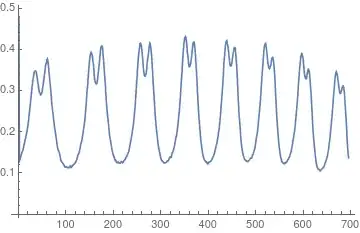
ListPlot@Mean@ImageData[img]– Szabolcs Oct 11 '17 at 18:43If someone knows another way to do that, I'd appreciate, to compare the results.
Gabriel
– Gabriel Das Neves Oct 12 '17 at 02:08ListPlot@ImageData[[n]]wherenis half the image height – george2079 Oct 12 '17 at 02:32