5

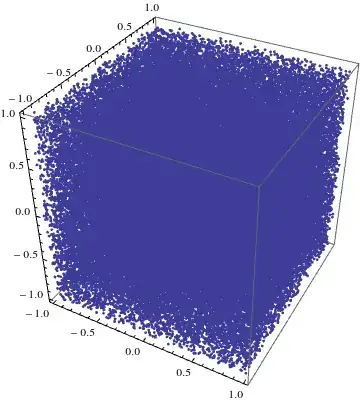
I have a large set of points that are close to manifold which I want to show in a ListPointPlot3D. Using part of the data set illustrates this

plot http://vollmer.ms/homog3d_0

plot http://vollmer.ms/homog3d_1

there are fewer data points in the middle.

But using all the data with

ListPointPlot3D[list[[2 ;; n]]]

results in

plot http://vollmer.ms/homog3d_2

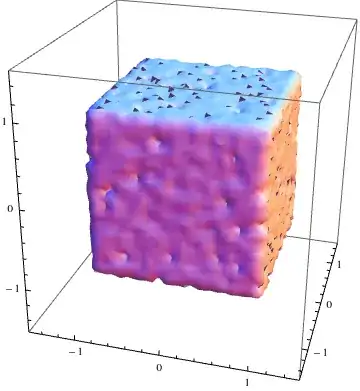
Is there a better way to visualize this? Somehow something like 3d contour plot of the density.

warsaga
  • 541
  • 3
  • 10

2 Answers2

3

If your point cloud is extremely "thick" you can create a RegionFunction. Here is a simple example using points in the cube from -1 to 1 in all directions.

pts = RandomReal[{-1, 1}, {10^5, 3}];

ListPointPlot3D[pts, BoxRatios -> 1]

enter image description here

Now create the function.

nf = Nearest[pts];

inRegion[pt : {_Real, _Real, _Real}, eps_Real] := 
 TrueQ[Norm[nf[pt, 1][[1]] - pt] < eps]

This will give an approximation to the boundary enclosing the region. We decide a point is "in" if it is within .04 of one of the points in the original list, else it is outside.

d = 1.5;
reg = RegionPlot3D[
  inRegion[{x, y, z}, .04], {x, -d, d}, {y, -d, d}, {z, -d, d}, 
  Mesh -> False, PlotPoints -> 40]

enter image description here

This code was gleefully cribbed from some work here (Also here)

Daniel Lichtblau
  • 58,970
  • 2
  • 101
  • 199
  • Thank you very much for the help. The problem with this approach is that I have outliers, and they get a ball around them, too. I am trying to use the cluster function, but this does not seem to work. – warsaga Dec 06 '12 at 00:31
  • Try it with Norm[nf[pt, 2][[2]] - pt]; that should force there to be at least two nearby points in order to be considered "inside". – Daniel Lichtblau Dec 06 '12 at 00:33
  • that is good but terribly slow.. – warsaga Dec 08 '12 at 17:01
  • I'm mildly surprised about the speed issue. Can you give details on how to produce a data set typical of the sort you encounter? – Daniel Lichtblau Dec 08 '12 at 20:54
1

In addition to what @Daniel Lichtblau described, let me give you a further idea. It is not completely clear whether it really helps in your case since frome the statement

I have a large set of points that are close to manifold

I can only guess and an example data-set would have been better.

What I would try is to estimate the local density of points and to make a ContourPlot3D (or a RegionPlot3D) which shows you the boundary of certain density.

You could for instance (and this is the difference to Daniels approach) calculate the distances from a point x to the next, say 30 points and then calculate the Mean or Median distance. This gives you kind of an estimation how dense x is surrounded by points.

Example:

data = ExampleData[{"Geometry3D", "StanfordBunny"}, "VertexData"];
With[{nf = Nearest[data]},
 density[x : {__?NumericQ}] := Mean[Map[Norm[x - #] &, nf[x, 30]]]
 ];
RegionPlot3D[
 density[{x, y, z}] < .01, {x, -.15, .1}, {y, -.1, .1}, {z, 0, .2}, 
 BoxRatios -> Automatic, PlotPoints -> 40]

Mathematica graphics

halirutan
  • 112,764
  • 7
  • 263
  • 474