Im New to Mathmatica and I'm having an issue with plotting the functions found with NDSolve. My code:
M = 0.0289644;(*Molar mass of air*)
R = 8.31447;(*ideal gas const*)
Po = 101325;(*Preassure at Sea level*)
L = 0.0065;(*Temp lapse rate*)
To = 288.15; (*Sea level Temp*)
g = 9.8 ;(*Gravity*)
dC = 1.3;(*DragCoeff.*)
A = 0.4;(*Area of Cross Section*)
m = 117.934; (*Mass*)
Rho[h_] = ((Po*(1 - L*h/To)^(g*M/(R*L)))*M)/(R*(To - L*h));
Fd = NDSolve[{.5*dC*A*Rho[y[t]]*(y'[t]^2) - m*g == m*y''[t], y[0] == 40000,
y'[0] == 0},{y[t]}, {t, 0, 300}]
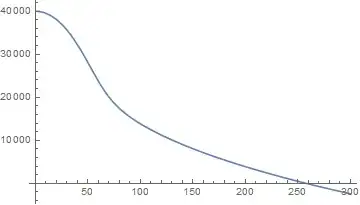
Plot[y[t] /. Fd, {t, 0, 300}]
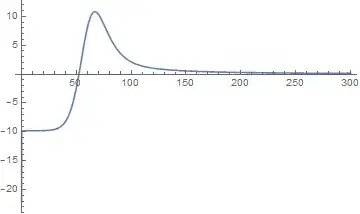
Plot[y'[t] /. Fd, {t, 0, 300}]
Plot[y''[t] /. Fd, {t, 0, 300}]
when plotting the position function, y[t], everything works fine, but plotting the velocity and accel functions are showing blank graphs. the x and y axis are still there, but the y range is only from -1 to 1. Not getting any messages, so not sure what is the issue here.