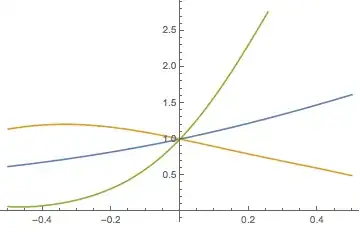
I would like to plot the Taylor polynomials for several functions. Specifically:
Exp[Sin[x]]
( x^2 + Exp[ x ] )^( -1 )
and
Exp[ -4 x^2 + 5 x]
I have their Taylor series as:
taylorFunction1[x_, n_] := Normal[Series[f1[x], { x, 0, n} ] ]
taylorFunction2[x_, n_] := Normal[Series[f2[x], {x,  0, n} ] ]
taylorFunction3[x_, n_] := Normal[Series[f3[x], {x,  0, n} ] ]
I would like to plot the functions of x and their Taylor series of degree n = 10 and compare each, specifically over the interval [-1/2, 1/2]. However, for some reason, whenever I use the "Plot[]" command, Mathematica just returns an empty graph. I come from a C programming background, but I am rather unfamiliar with Mathematica. Can anyone help me out and let me know what's going on?
Thanks!
Plotcode) inPlot, the symbolxis given a numeric value whereasSerieswould fail ifxis not a symbol. – Michael E2 Nov 26 '17 at 01:14